

In 2026, your customers don't just Google anymore — they ask ChatGPT, Claude, Gemini, Perplexity, and Google AI. If your brand isn't surfacing in those answers, you're invisible to a huge chunk of your audience.
RankBits is an AI visibility tracker that scans your brand across 16 AI engines and search sources, measures your mention and citation rates, ranks you against competitors, and tracks your visibility over time. And it has a REST API you can automate with Python.
In this tutorial, you'll learn how to:
- Create a RankBits API token
- Start an async AI visibility scan from Python
- Poll for results and parse the JSON response
- Visualize your visibility with matplotlib charts
Let's dive in.
Setting Up
First, sign up for RankBits (free accounts work). Then go to the API page and generate a token — you'll see a rb_... string. Copy it.
Install the only two dependencies we need:
pip install requests matplotlibSet your token as an environment variable so you don't hardcode it:
export RANKBITS_TOKEN="rb_your_token_here"The Full Script
Here's the complete Python script we'll walk through. It checks your account, creates a scan for any domain, polls until completion, and generates three charts:
"""
Track Your AI Visibility with Python & RankBits API.

This script demonstrates the full workflow:
1. Check your RankBits account and plan
2. Create an AI visibility scan for any domain
3. Poll until the scan completes
4. Parse the results and generate visualizations

Requirements:
    pip install requests matplotlib

Usage:
    export RANKBITS_TOKEN="rb_your_token_here"
    python ai_visibility_tracker.py
"""

import os
import sys
import time
import json

import requests
import matplotlib.pyplot as plt
import matplotlib.ticker as mticker

# ---------------------------------------------------------------------------
# Configuration
# ---------------------------------------------------------------------------

TOKEN = os.environ.get("RANKBITS_TOKEN", "rb_your_token_here")
BASE_URL = "https://rankbits.com/v1"
HEADERS = {
    "Authorization": f"Bearer {TOKEN}",
    "Content-Type": "application/json",
}

TARGET_URL = "https://example.com"  # ← change this
ENGINES = ["openai", "gemini", "perplexity", "claude", "google_ai_mode"]
PROMPT_COUNT = 5
Let's go through each section.
Step 1: Check Your Account
Before running a scan, it's good practice to verify your plan, credit balance, and available engines:
def check_account() -> dict:
    """Fetch plan info and credit usage from /v1/me."""
    resp = requests.get(f"{BASE_URL}/me", headers=HEADERS)
    resp.raise_for_status()
    data = resp.json()
    plan = data["plan"]
    resp_info = plan["responses"]

    print(f"🔑  Account")
    print(f"   Plan:     {plan['label']} (${plan['price_usd']}/mo)")
    print(f"   Monthly:  {resp_info['used']}/{resp_info['monthly_limit']} responses")
    print(f"   Credits:  {resp_info['purchased_remaining']} purchased remaining")
    return data
The /v1/me endpoint returns your user info, plan details, and response credit usage:
{
  "user": {"username": "yourname", "email": "you@example.com"},
  "plan": {
    "key": "pro",
    "label": "Pro",
    "allowed_provider_keys": ["openai", "gemini", "perplexity", "claude", ...],
    "responses": {
      "monthly_limit": 5000,
      "used": 1200,
      "remaining": 13800
    }
  }
}
Step 2: Create a Scan
The scan endpoint accepts a URL, prompt count, and optional engine list:
def create_scan(url: str, prompt_count: int = 5,
                providers: list[str] | None = None) -> dict:
    """Submit an async scan and return the public ID."""
    payload = {"url": url, "prompt_count": prompt_count}
    if providers:
        payload["providers"] = providers

    resp = requests.post(f"{BASE_URL}/scans", headers=HEADERS, json=payload)
    resp.raise_for_status()
    data = resp.json()

    scan = data["scan"]
    print(f"\n🚀  Scan created")
    print(f"   ID:        {scan['public_id']}")
    print(f"   Domain:    {scan['domain']}")
    print(f"   View live: https://rankbits.com{data['links']['app']}")
    return data
The response includes a public_id you'll use to poll for results. The scan runs asynchronously in the background.
Using Your Own Prompts
By default, RankBits auto-generates prompts by analyzing your brand's website — the prompts you see in this tutorial were AI-generated. If you'd rather ask the engines your own questions, pass a custom_prompts array instead (and set custom_only: true to skip auto-generated prompts):
payload = {
    "url": "https://yourbrand.com",
    "prompt_count": 3,
    "providers": ["openai", "gemini", "claude"],
    "custom_prompts": [
        "what is the best site to learn Python?",
        "compare thepythoncode.com vs realpython.com for tutorials",
        "top resources for learning ethical hacking with Python"
    ],
    "custom_only": True   # skip AI-generated prompts entirely
}
Available Engines
Here are all available engines — free ones work on any plan, while paid engines require a Pro subscription:
| Key | Engine | Plan |
|---|---|---|
openai | ChatGPT | Free |
gemini | Google Gemini | Free |
claude | Anthropic Claude | Free |
perplexity | Perplexity AI | Free |
google_ai_mode | Google AI Mode | Free |
google_ai_overview | Google AI Overview | Free |
google_search | Google Search | Free |
bing_search | Bing Search | Free |
bing_copilot | Bing Copilot | Free |
duckduckgo_search | DuckDuckGo Search | Pro |
yahoo_search | Yahoo Search | Pro |
tavily | Tavily | Free |
exa | Exa | Free |
openai_pro | ChatGPT Pro | Pro |
claude_pro | Claude Pro | Pro |
gemini_pro | Gemini Pro | Pro |
Step 3: Poll Until Complete
Scans take 30–90 seconds depending on prompt count and engine count. Poll the scan endpoint until the status is done:
def poll_scan(public_id: str, poll_seconds: float = 3.0,
              max_wait: float = 300.0) -> dict:
    """Poll /v1/scans/{id} until status is 'done' or timeout."""
    url = f"{BASE_URL}/scans/{public_id}"
    start = time.time()
    last_completed = 0

    print(f"\n⏳  Polling scan {public_id} ...")
    while True:
        elapsed = time.time() - start
        if elapsed > max_wait:
            raise TimeoutError(f"Scan did not complete within {max_wait}s")

        resp = requests.get(url, headers=HEADERS)
        resp.raise_for_status()
        data = resp.json()

        status = data["scan"]["status"]
        progress = data.get("progress", {})
        completed = progress.get("completed_results", 0)
        expected = progress.get("expected_results", 0)

        if completed != last_completed:
            pct = (completed / expected * 100) if expected else 0
            print(f"   [{status}] {completed}/{expected} ({pct:.0f}%)")
            last_completed = completed

        if status == "done":
            print("   ✅  Scan complete!")
            return data
        if status in ("error", "failed"):
            raise RuntimeError(f"Scan failed: {data}")

        time.sleep(poll_seconds)
Step 4: Parse the Results
Once the scan completes, the response includes everything you need:
def summarize_results(data: dict) -> None:
    """Print a human-readable summary of scan results."""
    aggregate = data.get("aggregate", {})
    overall = aggregate.get("overall", {})
    providers = aggregate.get("providers", {})
    results = data.get("results", [])
    prompts = data.get("prompts", [])

    print(f"\n📊  Visibility Summary for {data['scan']['domain']}")
    print(f"   Overall score:      {overall.get('score', 'N/A')}")
    print(f"   Mention rate:       {overall.get('mention_rate', 0):.1f}%")
    print(f"   Citation rate:      {overall.get('citation_rate', 0):.1f}%")

    # Per-engine breakdown
    print(f"\n🤖  Engine Breakdown")
    for key, pdata in sorted(providers.items(),
                             key=lambda x: -x[1].get("score", 0)):
        print(f"   {key:<20s} Score: {pdata.get('score', 0):>5.1f}  "
              f"Mention: {pdata.get('mention_rate', 0):>5.1f}%  "
              f"Citation: {pdata.get('citation_rate', 0):>5.1f}%")
The key fields in the response:
| Field | Description |
|---|---|
aggregate.overall.score | Overall visibility score (0–100) |
aggregate.overall.mention_rate | % of answers that named your brand |
aggregate.overall.citation_rate | % of answers that linked to your site |
aggregate.providers | Per-engine scores and rates |
aggregate.share_of_voice | Most-cited domains across all answers |
aggregate.comparison | You vs competitors ranked by visibility |
results[] | Row-level engine × prompt answers |
prompts[] | The prompts used in this scan |
Each result row contains:
{
  "provider": "claude",
  "prompt": "best free python tutorials for beginners with hands-on projects",
  "brand_mentioned": true,
  "brand_cited": false,
  "mention_count": 1,
  "brand_rank": null,
  "answer_text": "## Best Free Python Tutorials ...",
  "citations": [{"url": "...", "title": "...", "domain": "..."}],
  "latency_ms": 11297
}
Step 5: Generate Charts
Let's turn the data into three matplotlib visualizations:
Chart 1: Visibility Score by Engine
A horizontal bar chart showing how each AI engine scored your brand:
def generate_charts(data: dict, output_dir: str = ".") -> None:
    aggregate = data.get("aggregate", {})
    providers = aggregate.get("providers", {})
    domain = data["scan"]["domain"]

    engines = sorted(providers.items(), key=lambda x: -x[1].get("score", 0))
    names = [e[0].replace("_", " ").title() for e in engines]
    scores = [e[1].get("score", 0) for e in engines]
    mention_rates = [e[1].get("mention_rate", 0) for e in engines]
    citation_rates = [e[1].get("citation_rate", 0) for e in engines]

    # ---- Chart 1: Scores by engine ----
    fig1, ax1 = plt.subplots(figsize=(8, 5))
    bars = ax1.barh(names, scores, color="#7c3aed",
                    edgecolor="white", linewidth=0.5, height=0.5)
    ax1.set_xlabel("Visibility Score (0–100)", fontsize=11)
    ax1.set_title(f"AI Visibility Score by Engine — {domain}",
                  fontsize=13, fontweight="bold")
    ax1.invert_yaxis()
    for bar, val in zip(bars, scores):
        ax1.text(bar.get_width() + 0.5,
                 bar.get_y() + bar.get_height() / 2,
                 f"{val:.1f}", va="center", fontsize=10,
                 fontweight="semibold")
    ax1.set_xlim(0, max(scores) * 1.3 + 5 if max(scores) > 0 else 30)
    plt.tight_layout()
    fig1.savefig(f"{output_dir}/engine_scores.png", dpi=150)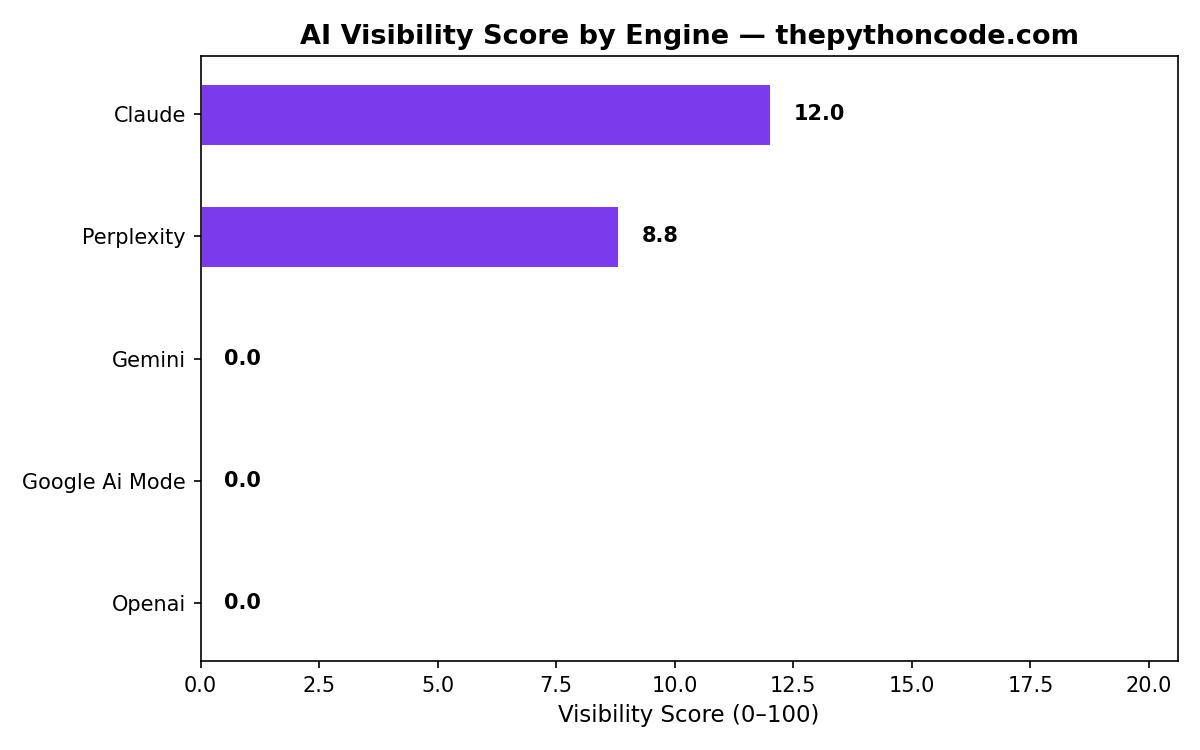
Chart 2: Mention vs Citation Rates
A grouped bar chart comparing how often each engine mentions your brand versus citing your site:
    # ---- Chart 2: Mention vs Citation rates ----
    fig2, ax2 = plt.subplots(figsize=(8, 5))
    x = range(len(names))
    width = 0.35
    ax2.bar([i - width / 2 for i in x], mention_rates, width,
            label="Mention Rate %", color="#10b981",
            edgecolor="white", linewidth=0.5)
    ax2.bar([i + width / 2 for i in x], citation_rates, width,
            label="Citation Rate %", color="#f59e0b",
            edgecolor="white", linewidth=0.5)
    ax2.set_xticks(x)
    ax2.set_xticklabels(names, fontsize=9)
    ax2.set_ylabel("Percentage (%)", fontsize=11)
    ax2.set_title(f"Mention vs Citation Rate — {domain}",
                  fontsize=13, fontweight="bold")
    ax2.legend(fontsize=10, loc="upper right")
    ax2.set_ylim(0, max(max(mention_rates), max(citation_rates)) * 1.4 + 5)
    plt.tight_layout()
    fig2.savefig(f"{output_dir}/mention_vs_citation.png", dpi=150)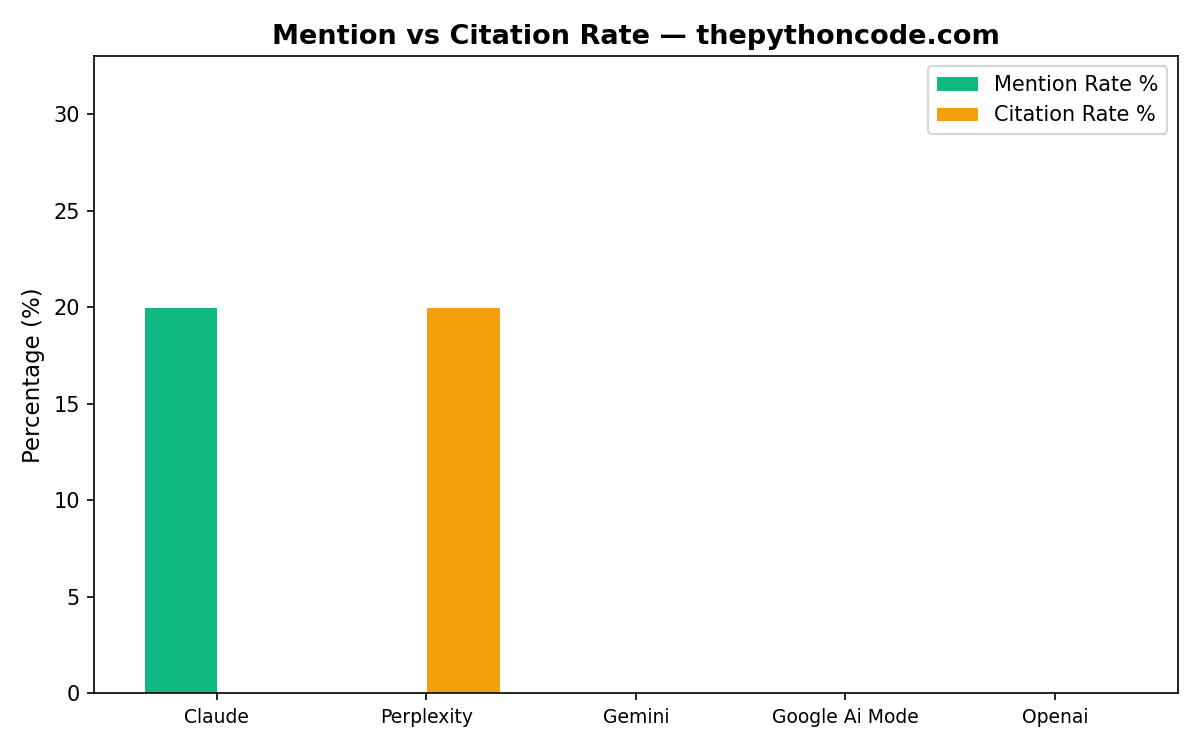
Chart 3: Presence Grid (Heatmap)
A visual matrix showing where your brand appeared across every engine × prompt combination:
    # ---- Chart 3: Presence grid (heatmap) ----
    results = data.get("results", [])
    prompt_texts = sorted({r["prompt"][:60] for r in results})
    engine_names = sorted({r["provider"] for r in results})

    matrix = []
    for pt in prompt_texts:
        row = []
        for eng in engine_names:
            match = [r for r in results
                     if r["prompt"].startswith(pt[:30])
                     and r["provider"] == eng]
            if match:
                m = match[0]
                if m["brand_cited"]:
                    row.append(2)      # cited (best)
                elif m["brand_mentioned"]:
                    row.append(1)      # mentioned
                else:
                    row.append(0)      # absent
            else:
                row.append(0)
        matrix.append(row)

    fig3, ax3 = plt.subplots(figsize=(max(8, len(engine_names) * 1.2),
                                       max(5, len(prompt_texts) * 0.6)))
    im = ax3.imshow(matrix, cmap=plt.cm.RdYlGn, aspect="auto", vmin=0, vmax=2)
    ax3.set_xticks(range(len(engine_names)))
    ax3.set_xticklabels([e.replace("_", " ").title() for e in engine_names],
                        rotation=30, ha="right", fontsize=9)
    ax3.set_yticks(range(len(prompt_texts)))
    ax3.set_yticklabels(prompt_texts, fontsize=8)

    for i in range(len(prompt_texts)):
        for j in range(len(engine_names)):
            val = matrix[i][j]
            symbol = {0: "○", 1: "▲", 2: "★"}[val]
            ax3.text(j, i, symbol, ha="center", va="center",
                     fontsize=14, color="black" if val == 2 else "white")

    ax3.set_title(f"Presence Grid — {domain}\n○ Absent  ▲ Mentioned  ★ Cited",
                  fontsize=12, fontweight="bold")
    plt.tight_layout()
    fig3.savefig(f"{output_dir}/presence_grid.png", dpi=150)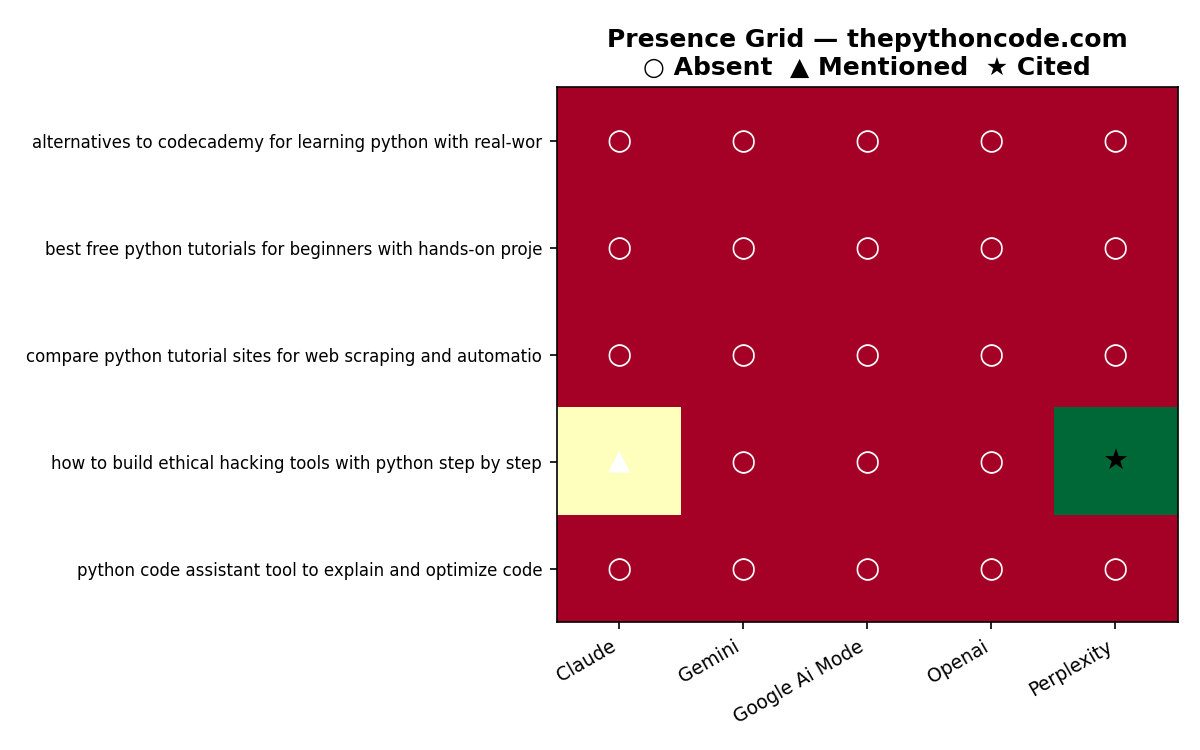
Real Results: Scanning The Python Code
I ran this exact script against thepythoncode.com with 5 prompts across 5 engines (ChatGPT, Gemini, Claude, Perplexity, Google AI Mode). Here's what came back:
🔑  Account
   Plan:     Pro ($99/mo)
   Monthly:  4852/5000 responses
   Credits:  13920 purchased remaining

🚀  Scan created
   ID:        7rr9jgajan
   Domain:    thepythoncode.com

⏳  Polling scan 7rr9jgajan ...
   [running] 1/25 (4%)
   [running] 10/25 (40%)
   [running] 22/25 (88%)
   ✅  Scan complete!

📊  Visibility Summary for thepythoncode.com
   Overall score:      N/A
   Mention rate:       4.0%
   Citation rate:      4.0%

🤖  Engine Breakdown
   Engine              Score   Mention%  Citation%
   claude              12.0      20.0%       0.0%
   perplexity           8.8       0.0%      20.0%
   openai               0.0       0.0%       0.0%
   gemini               0.0       0.0%       0.0%
   google_ai_mode       0.0       0.0%       0.0%

💬  Prompts (5) — auto-generated by RankBits
   • best free python tutorials for beginners with hands-on projects
   • how to build ethical hacking tools with python step by step
   • compare python tutorial sites for web scraping and automation
   • python code assistant tool to explain and optimize code
   • alternatives to codecademy for learning python with real-world examples

✅  Where thepythoncode.com Appeared (2/25)
   [claude     ] Mentioned: ✅  Cited: ❌
     Prompt: how to build ethical hacking tools with python step by step
   [perplexity ] Mentioned: ❌  Cited: ✅
     Prompt: how to build ethical hacking tools with python step by step
The hard truth: Out of 25 AI answers (5 prompts × 5 engines), thepythoncode.com was mentioned only once (by Claude) and cited only once (by Perplexity). ChatGPT, Gemini, and Google AI Mode didn't surface it at all. That's a 4% visibility rate.
This is actually common — many sites that rank well on Google are nearly invisible on AI engines because AI models cite different sources than search engines rank.
🔗 View the full public scan results: https://rankbits.com/scans/7rr9jgajan
Taking It Further: Scheduled Tracking
Once a scan completes, you can enable scheduled tracking to monitor visibility over time:
# Enable weekly tracking on a completed scan
resp = requests.post(
    f"{BASE_URL}/scans/{public_id}/tracking",
    headers=HEADERS,
    json={"frequency_days": 7}
)

# Retrieve tracking history with time-series data
resp = requests.get(
    f"{BASE_URL}/scans/{public_id}/tracking",
    headers=HEADERS
)
tracking_data = resp.json()
for point in tracking_data["history"]:
    print(f"{point['at']}: score={point['overall_score']:.1f} "
          f"mentions={point['mention_count']} citations={point['citation_count']}")
The tracking endpoint returns a time-series you can feed into line charts to visualize visibility trends week over week.
Running It Yourself
- Sign up for RankBits — free accounts work
- Get your API token from the API page
- Download the script (use the download button above)
- Run it:
export RANKBITS_TOKEN="rb_your_token_here"
python ai_visibility_tracker.py
Change TARGET_URL to your own domain and adjust ENGINES to match your plan.
Why This Matters
AI assistants are the new search. In 2025, ChatGPT alone processed over 2.5 billion prompts per day (confirmed by OpenAI). Google AI Overviews reached 1.5 billion monthly users. And a 2026 study found that nearly 30% of AI Overview cited domains didn't appear anywhere in the first page of organic results.
If you're only tracking Google rankings, you're blind to the channel your customers use most.
RankBits gives you the API to measure, monitor, and improve your AI visibility — and now you can automate the entire thing with Python.
Complete Code
The full script with all functions is available for download below. It includes account checking, scan creation, polling, result parsing, and chart generation in ~200 lines of Python.
Further reading:
Got a coding query or need some guidance before you comment? Check out this Python Code Assistant for expert advice and handy tips. It's like having a coding tutor right in your fingertips!