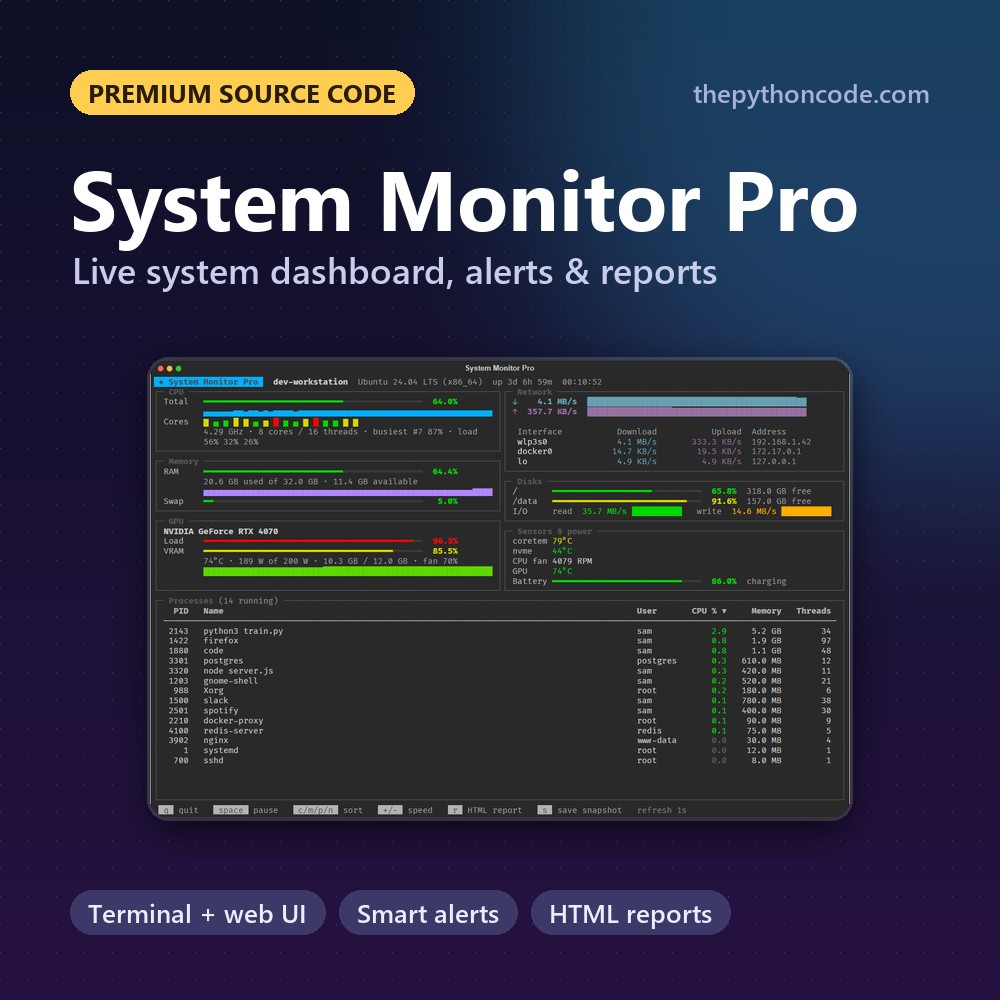
System Monitor Pro
A live system dashboard in Python: terminal and web UIs, smart alerts, recordings and HTML reports.
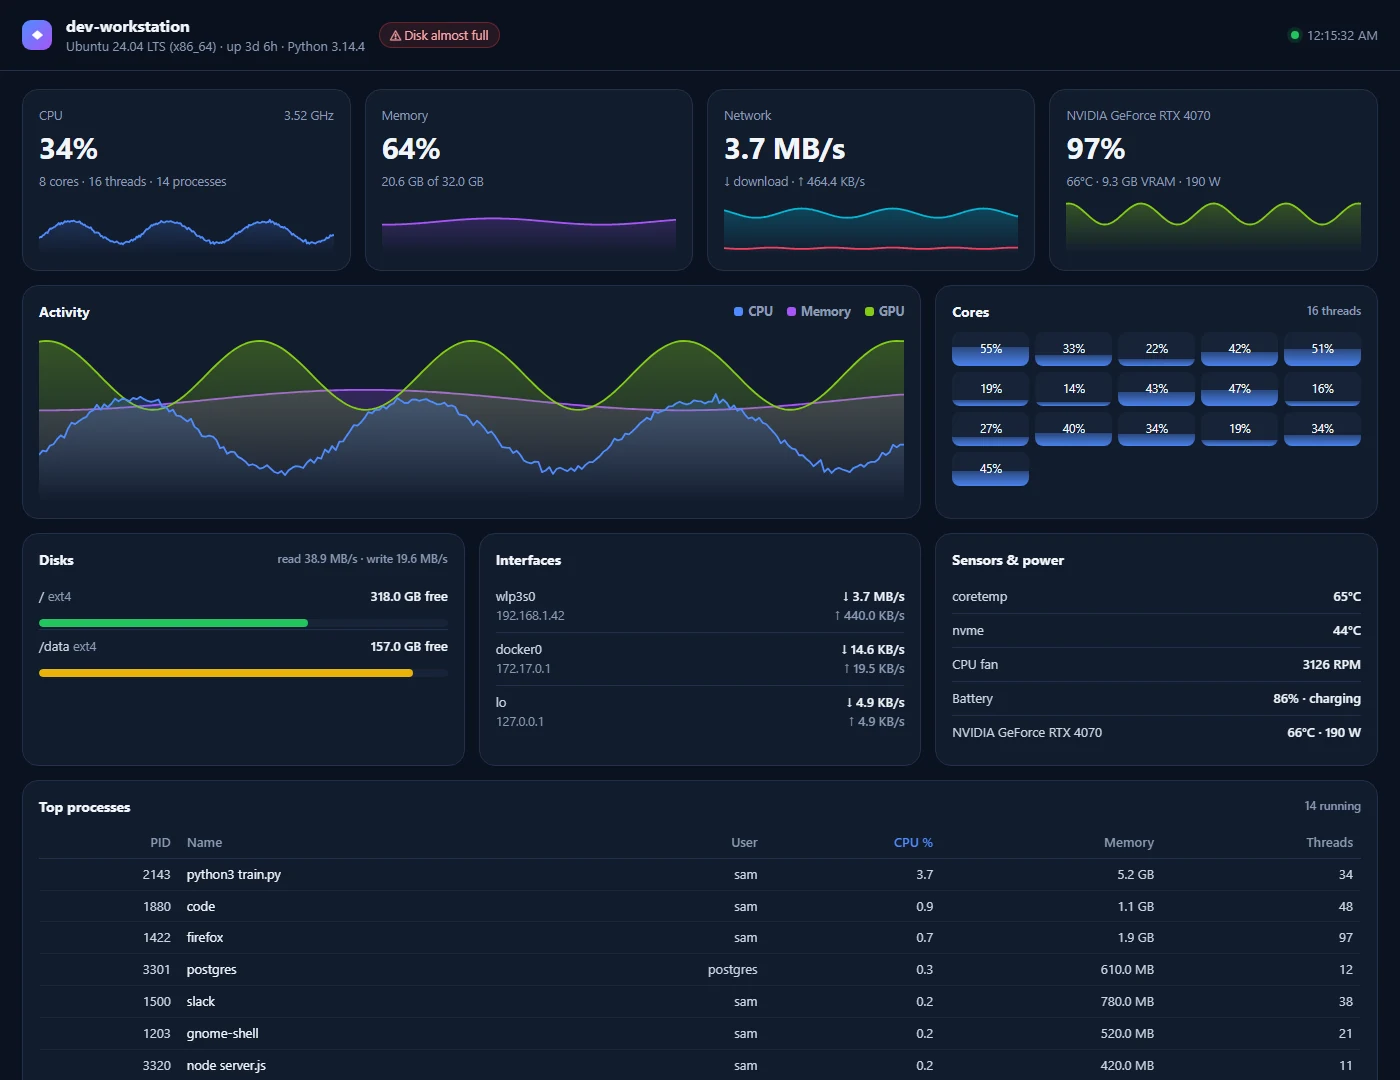
The complete version of our hardware and system information tutorial: a live terminal dashboard (every core, RAM, disks, network, NVIDIA GPU, sensors, processes), a live web dashboard served by the standard library, alerts with duration and hysteresis, long recordings to SQLite and self-contained HTML reports with charts. Works on Windows, macOS and Linux.
Upgrades the free tutorial: How to Get Hardware and System Information in Python
What makes it “Pro”
Everything the tutorial leaves as an exercise, done properly.
Live terminal dashboard
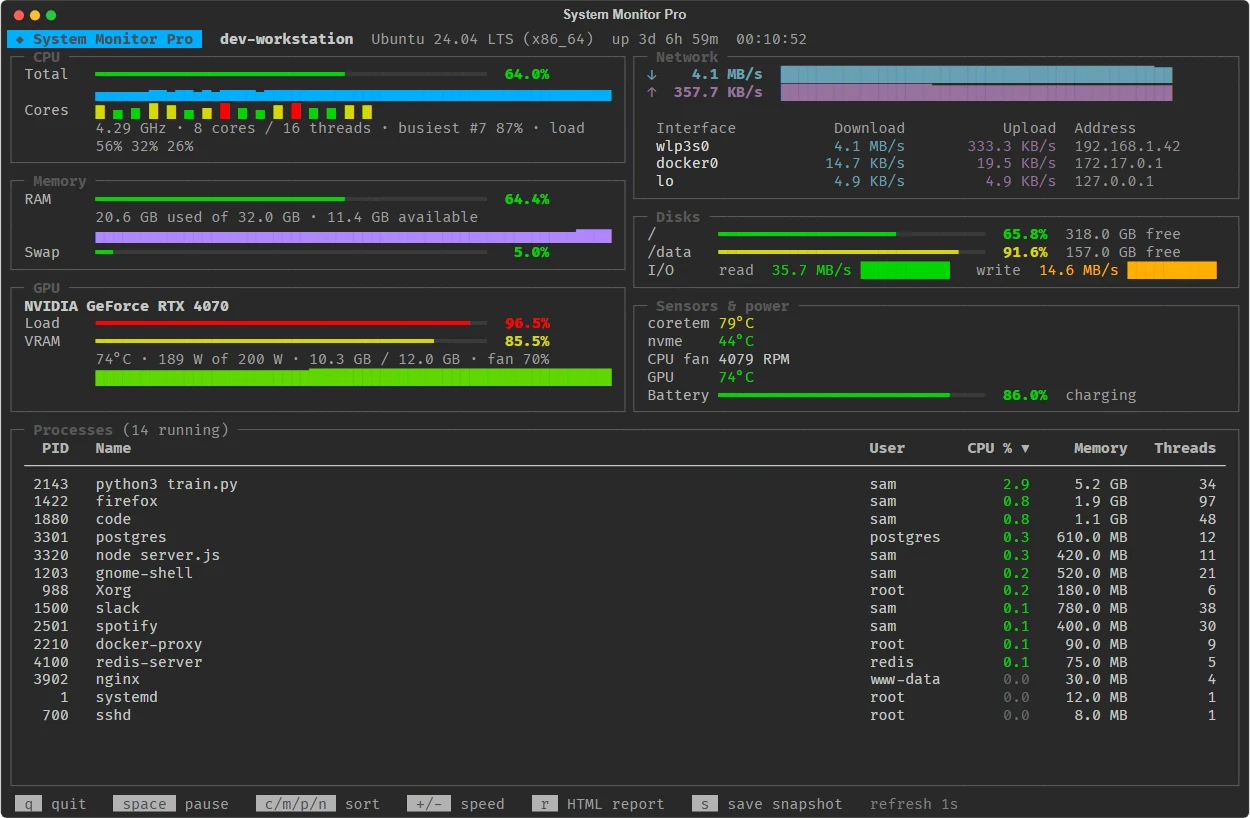
CPU with every core, RAM, disks, network, GPU, sensors and a sortable process list, sized to your terminal.
Live web dashboard
A single-page dashboard with live charts over Server-Sent Events. No Flask, no CDN.
Smart alerts
"CPU above 90% for 30 s": duration, hysteresis and cooldown, with native desktop notifications.
Recordings
Record for hours or weeks to SQLite or CSV, with a background sampler that never freezes the UI.
HTML reports
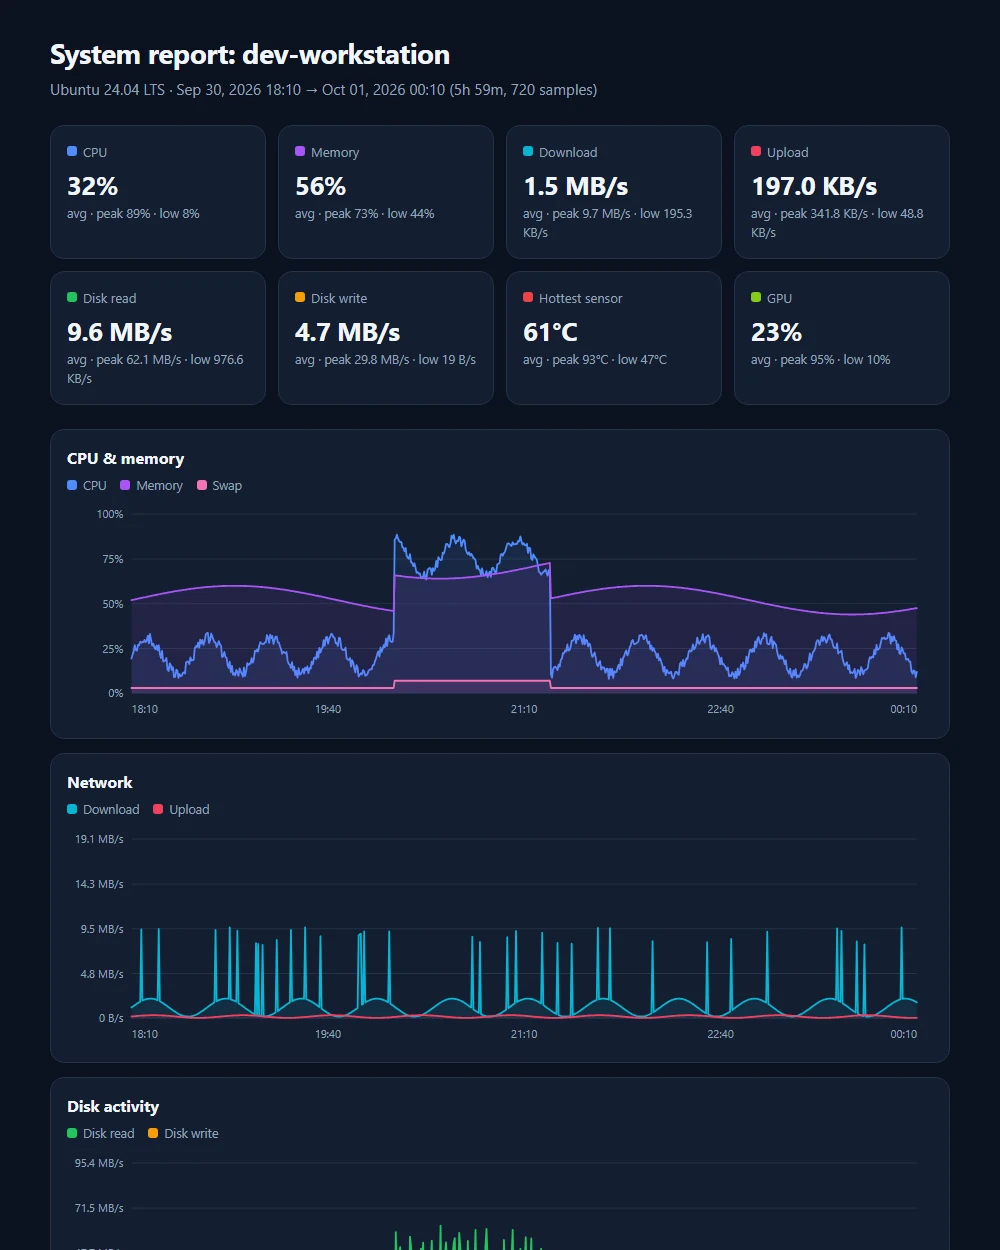
One self-contained file with summary cards, SVG charts and the alerts that would have fired.
NVIDIA GPU
Load, VRAM, temperature and power through nvidia-smi, with no extra package.
Clean, injectable design
psutil is injectable, so every metric can be tested and faked.
Tested
11 pytest tests with a fake psutil: rates, alerts, recorder, reports, dashboard and web API.
Screenshots
Real output of the tools. Sample data is used wherever a screenshot would show private information (networks, emails, processes).
Free tutorial vs. System Monitor Pro
The tutorial is great for learning the basics. This is the version you'd actually ship.
| Free tutorial | System Monitor Pro | |
|---|---|---|
| Output | A printed report | Live terminal + web dashboards |
| Refresh | Once | Continuous, in a background thread |
| History | — | Sparklines, charts, recordings |
| Alerts | — | ✓ duration, hysteresis, notifications |
| Reports | Text/JSON | HTML with charts |
| Processes | — | Sortable, per-process CPU and memory |
| Tests | — | 11 pytest tests |
A peek at the code
Clean, commented, modular Python. Here's the start of sysmon_pro/alerts.py:
    def check(self, get_metric: Callable[[str], Optional[float]], now: float) -> List[Event]:
        """Evaluate every rule; ``get_metric`` maps a metric path to its value."""
        events = []
        for rule in self.rules:
            if not rule.enabled:
                continue
            value = get_metric(rule.metric)
            st = self._state[rule.name]
            if value is None:
                st.since = None
                continue
            if st.active:
                if rule.recovered(value):
                    st.active, st.since = False, None
What's inside
- Full source code (≈2,200 lines, 14 modules)
- Terminal dashboard, web dashboard and CLI
- README with an architecture guide
- 11 unit tests (pytest)
- Free updates + commercial-use license
Get all 5 tools for $29
The Python Tools Pro Pack includes System Monitor Pro plus our other premium tools, for $29 instead of $65 when bought one by one.
What's in the pack?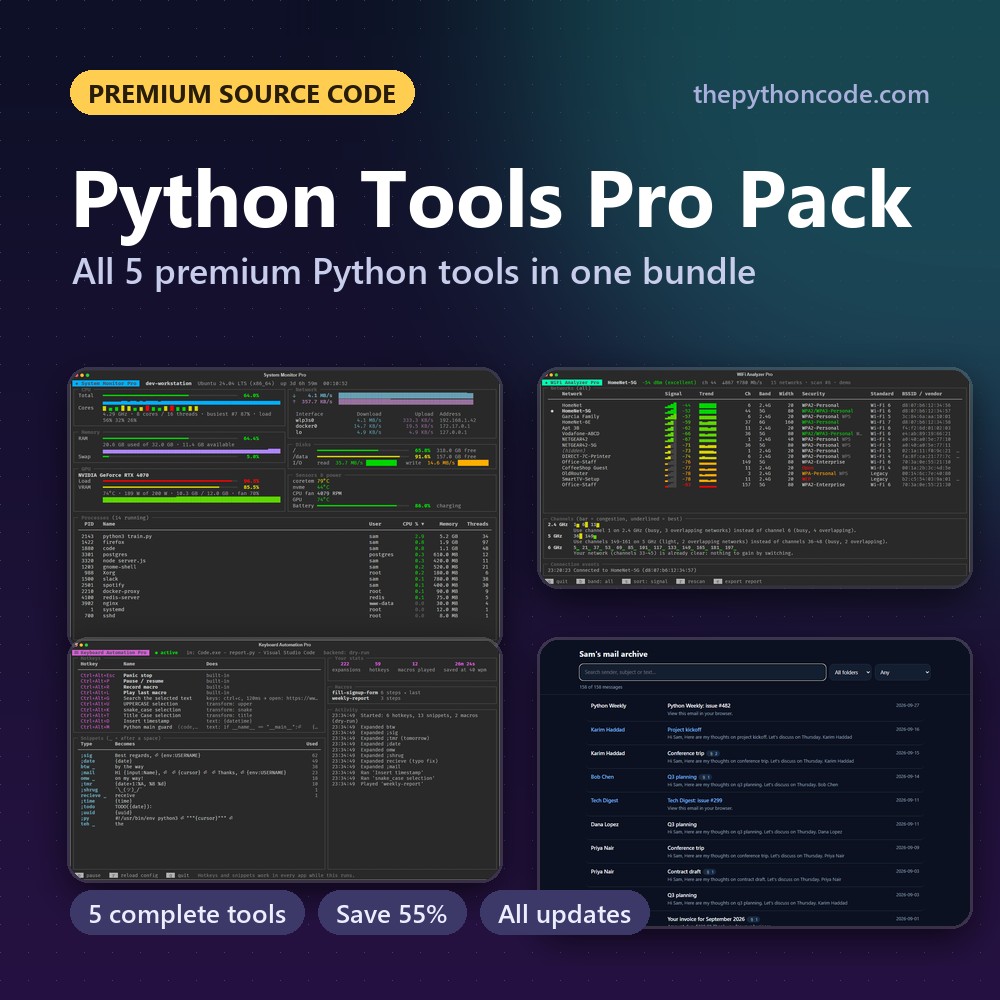
FAQ
What do I need to run it?
Python 3.8 or newer with psutil and rich (pip install -r requirements.txt). Windows, macOS and Linux. NVIDIA GPUs are read through nvidia-smi, installed with the driver.
How do I get the files after paying?
You're sent straight to your download page, and we email you the link too. The link keeps working, so you can re-download updated versions later. Lost it? Recover your downloads with your email.
Is this beginner-friendly?
If you've followed our free tutorial, yes. The code is split into small, commented modules, and the README walks through the architecture. It's the ideal next step after the tutorial.
Can I use it in my own projects?
Yes. You can modify it, learn from it, and ship your own tools and apps built on it, even commercially. The only thing you can't do is redistribute or resell the source code itself.
What if it's not for me?
Email us within 14 days and we'll refund you. No questions asked.
Get System Monitor Pro now
$12 one-time. Instant download, free updates.
More premium source code
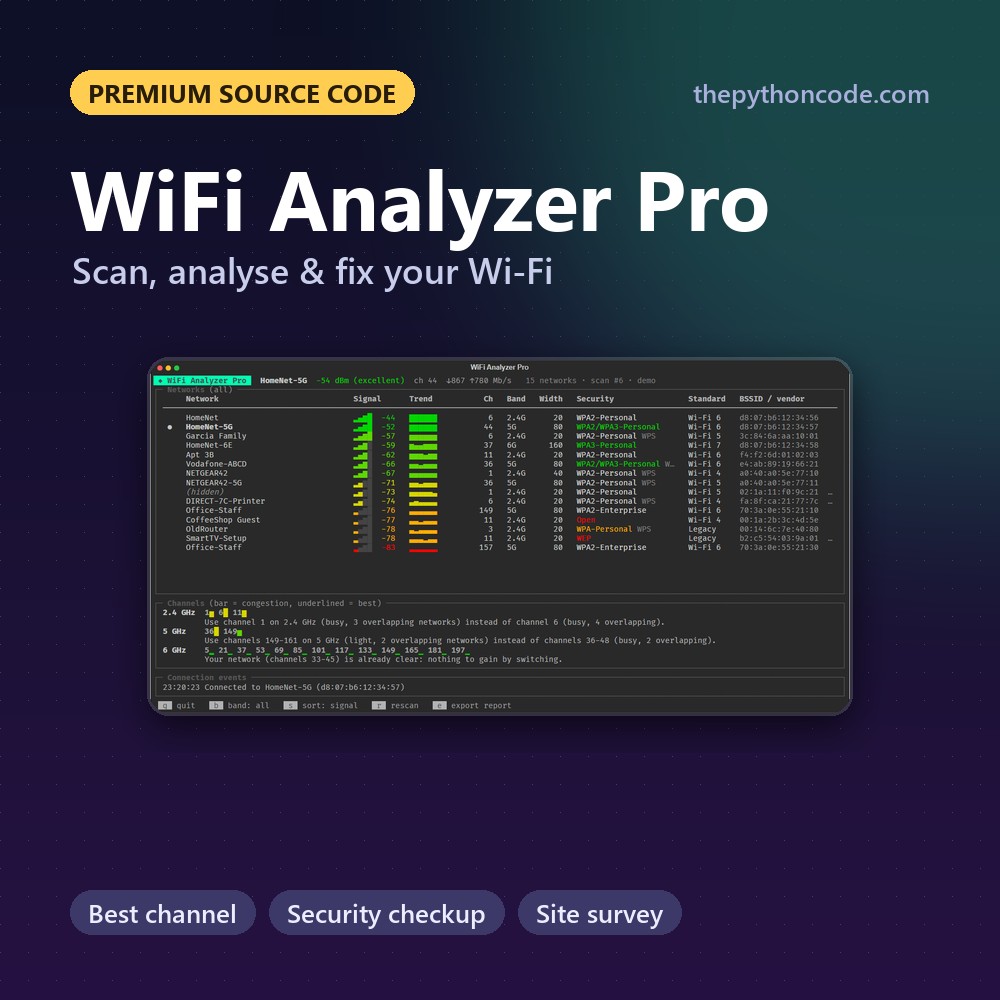
WiFi Analyzer Pro
Scan, analyse and improve your Wi-Fi in Python: best channel, security checkup, site survey and reports
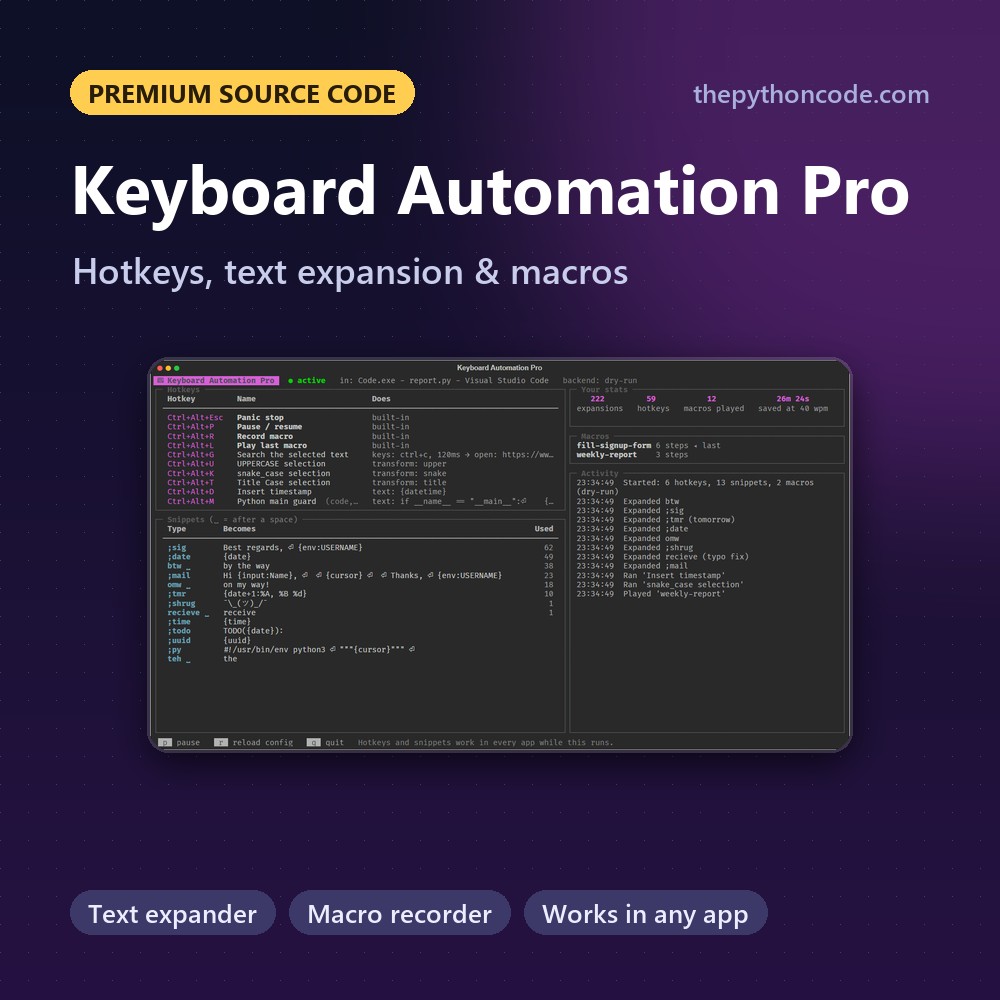
Keyboard Automation Pro
Global hotkeys, a text expander and a macro recorder in Python that work in every app
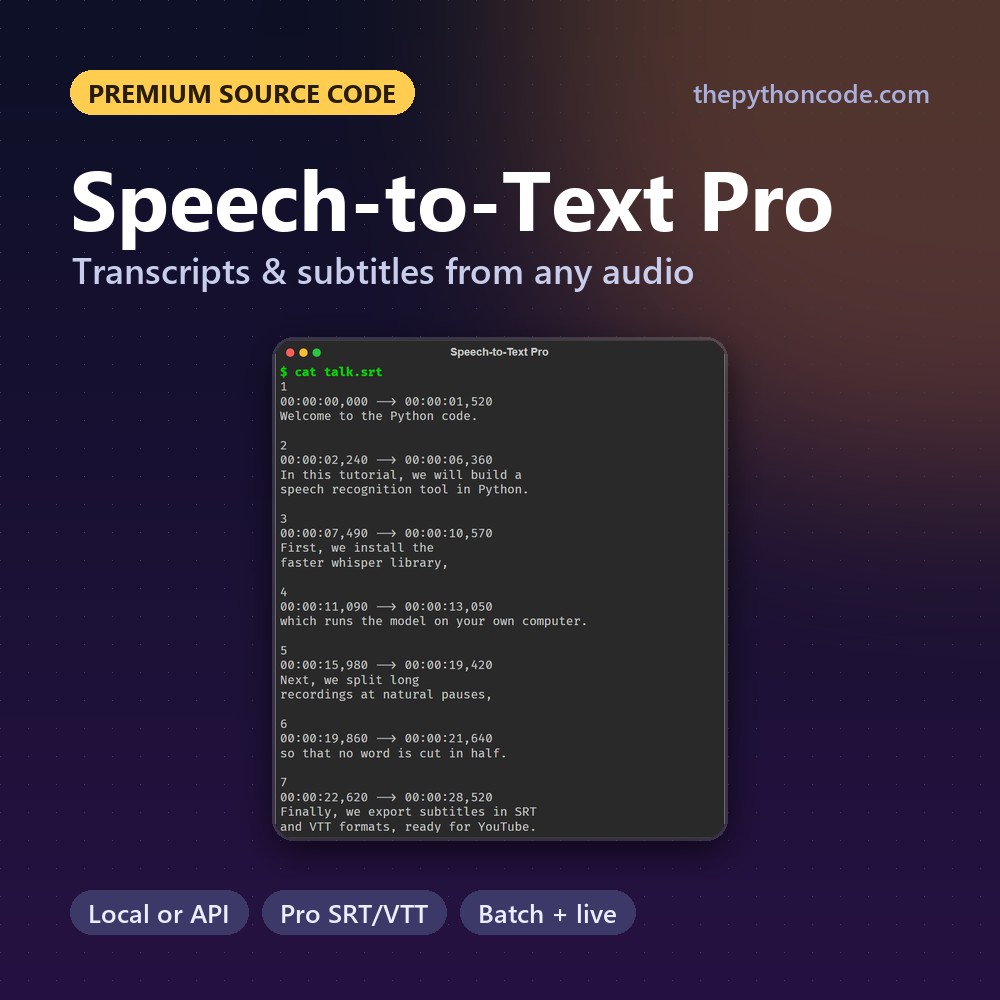
Speech-to-Text Pro
Transcripts and subtitles from any audio or video in Python, locally or with the OpenAI and Groq APIs
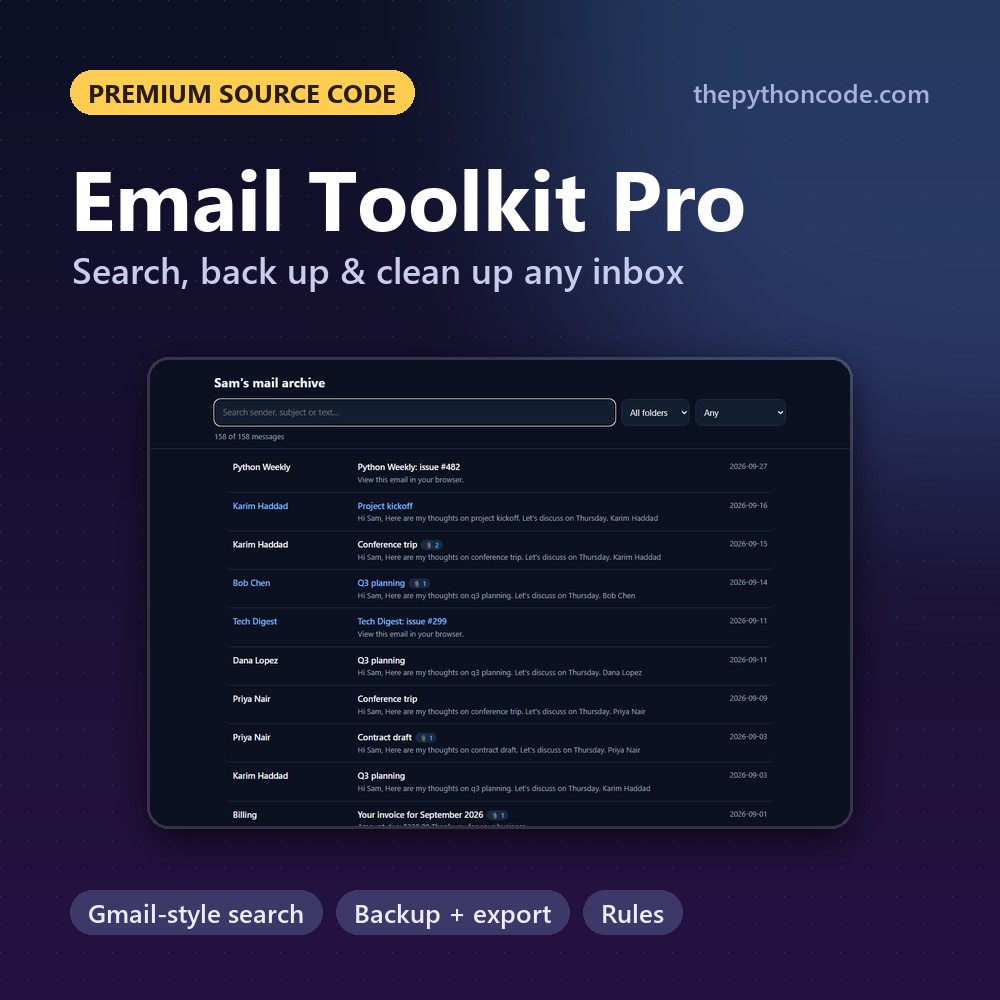
Email Toolkit Pro
Search, back up, export and clean up any IMAP mailbox in Python, with Gmail-style queries and rules

Game Dev Pro Pack
All five premium Python games in one download: Tetromino, Flappy Wings, Chess, Snake and Platformer Pro