Step up your coding game with AI-powered Code Explainer. Get insights like never before!
There are plenty of command-line tools for checking system information: uname, hostnamectl, lscpu, free, df, ifconfig, nvidia-smi, Task Manager, Activity Monitor, and so on. They are useful, but sometimes you want the same information inside a Python script: for a support bundle, a monitoring dashboard, a CLI health check, an inventory report, or a bug report generated automatically by your app.
In this tutorial, we will build a practical Python script that collects hardware and system information, including:
- operating system, Python version, architecture, boot time, and uptime;
- CPU model, core count, frequency, per-core usage, and load average;
- RAM and swap usage;
- mounted disks, disk usage, and disk I/O counters;
- network interfaces, IP addresses, MAC addresses, link state, and traffic counters;
- battery, temperature, and fan sensors where the OS exposes them;
- NVIDIA GPU information through
nvidia-smiwhen available; - optional JSON export and top processes by CPU usage.
The main library we will use is psutil, which is still the best general-purpose Python package for cross-platform system monitoring. We will also use Python's built-in platform module, and optionally py-cpuinfo for a nicer CPU name.
Related: How to Make a Process Monitor in Python.
Installing the Dependencies
Install the required packages:
pip install -U psutil py-cpuinfopy-cpuinfo is optional. The script below still works without it; it just falls back to platform.processor() or platform.machine() for the CPU name.
For NVIDIA GPU details, you do not need a Python package. You need the NVIDIA driver installed and the nvidia-smi command available in your terminal:
nvidia-smiIf that command does not exist, the script simply reports no NVIDIA GPU information and continues.
Converting Bytes and Uptime to Readable Values
Most system APIs return byte counts and seconds. Before printing anything, it is worth making two small helpers:
def bytes_to_human(value, suffix="B"):
    if value is None:
        return "N/A"
    value = float(value)
    for unit in ("", "K", "M", "G", "T", "P"):
        if abs(value) < 1024:
            return f"{value:.2f}{unit}{suffix}"
        value /= 1024
    return f"{value:.2f}EB"


def seconds_to_human(seconds):
    if seconds is None or seconds < 0:
        return "N/A"
    seconds = int(seconds)
    days, remainder = divmod(seconds, 86_400)
    hours, remainder = divmod(remainder, 3_600)
    minutes, seconds = divmod(remainder, 60)
    parts = []
    if days:
        parts.append(f"{days}d")
    if hours:
        parts.append(f"{hours}h")
    if minutes:
        parts.append(f"{minutes}m")
    if seconds or not parts:
        parts.append(f"{seconds}s")
    return " ".join(parts)
This keeps the final output readable: 17179869184 becomes 16.00GB, and uptime becomes something like 3d 4h 22m.
Getting Operating System and Python Information
The platform module gives us the OS name, release, version, architecture, and Python runtime details. psutil.boot_time() gives us the system boot timestamp:
import platform
import sys
import time
from datetime import datetime

import psutil


def timestamp_to_iso(timestamp):
    return datetime.fromtimestamp(timestamp).astimezone().isoformat(timespec="seconds")


uname = platform.uname()
boot_time = psutil.boot_time()

print("System:", uname.system)
print("Node:", uname.node)
print("Release:", uname.release)
print("Machine:", uname.machine)
print("Architecture:", platform.architecture()[0])
print("Python:", platform.python_version())
print("Python executable:", sys.executable)
print("Boot time:", timestamp_to_iso(boot_time))
print("Uptime:", seconds_to_human(time.time() - boot_time))
On Linux, Python 3.10+ also includes platform.freedesktop_os_release(), which can return distribution metadata such as Debian GNU/Linux 12, Ubuntu 24.04, and so on. The full script uses it when available.
Getting CPU Information
psutil can report physical cores, logical cores, current frequency, CPU usage, and per-core usage:
import os
import psutil

freq = psutil.cpu_freq()
print("Physical cores:", psutil.cpu_count(logical=False))
print("Logical cores:", psutil.cpu_count(logical=True))

if freq:
    print("Current frequency:", round(freq.current, 2), "MHz")
    print("Min frequency:", round(freq.min, 2), "MHz")
    print("Max frequency:", round(freq.max, 2), "MHz")

per_core = psutil.cpu_percent(interval=0.5, percpu=True)
print("Per-core usage:", per_core)
print("Total CPU usage:", psutil.cpu_percent(interval=None), "%")

if hasattr(os, "getloadavg"):
    print("Load average:", os.getloadavg())
Notice the interval=0.5. CPU utilization is measured over time, so using a short interval gives a more useful sample than asking for an instant value.
Getting Memory and Swap Usage
RAM and swap usage are straightforward:
svmem = psutil.virtual_memory()
swap = psutil.swap_memory()

print("Total RAM:", bytes_to_human(svmem.total))
print("Available RAM:", bytes_to_human(svmem.available))
print("Used RAM:", bytes_to_human(svmem.used))
print("RAM usage:", svmem.percent, "%")

print("Total swap:", bytes_to_human(swap.total))
print("Used swap:", bytes_to_human(swap.used))
print("Swap usage:", swap.percent, "%")
The full code stores both raw byte values and human-readable values. Raw numbers are better for JSON and dashboards; formatted strings are better for terminal output.
Getting Disk Usage and Disk I/O
For disks, we usually want two things: mounted partitions and I/O counters since boot.
for partition in psutil.disk_partitions():
    try:
        usage = psutil.disk_usage(partition.mountpoint)
    except (PermissionError, FileNotFoundError, OSError):
        continue

    print("Device:", partition.device)
    print("Mountpoint:", partition.mountpoint)
    print("Filesystem:", partition.fstype)
    print("Total:", bytes_to_human(usage.total))
    print("Used:", bytes_to_human(usage.used))
    print("Free:", bytes_to_human(usage.free))
    print("Percent:", usage.percent)

io = psutil.disk_io_counters()
if io:
    print("Disk read:", bytes_to_human(io.read_bytes))
    print("Disk write:", bytes_to_human(io.write_bytes))
Some mountpoints may be inaccessible without extra permissions, and containers sometimes expose unusual filesystems. That is why the full script catches PermissionError, FileNotFoundError, and OSError. It also falls back to checking / if disk_partitions() returns an empty list.
Getting Network Interfaces and Traffic Counters
Network information is slightly more verbose because each interface can have multiple addresses: IPv4, IPv6, and a link-layer/MAC address.
import socket
import psutil

for name, addresses in psutil.net_if_addrs().items():
    print("Interface:", name)
    for address in addresses:
        if address.family == socket.AF_INET:
            print("  IPv4:", address.address)
            print("  Netmask:", address.netmask)
        elif address.family == socket.AF_INET6:
            print("  IPv6:", address.address)
        elif hasattr(psutil, "AF_LINK") and address.family == psutil.AF_LINK:
            print("  MAC:", address.address)

stats = psutil.net_if_stats()
for name, stat in stats.items():
    print(name, "up=" + str(stat.isup), "speed=" + str(stat.speed), "Mbps")

io = psutil.net_io_counters()
print("Bytes sent:", bytes_to_human(io.bytes_sent))
print("Bytes received:", bytes_to_human(io.bytes_recv))
In the complete script, network counters are collected both per interface and globally.
Battery, Temperature, and Fan Sensors
psutil exposes a few sensor APIs, but support depends heavily on the operating system and hardware:
battery = psutil.sensors_battery()
if battery:
    print("Battery:", battery.percent, "%")
    print("Plugged in:", battery.power_plugged)

if hasattr(psutil, "sensors_temperatures"):
    print(psutil.sensors_temperatures())

if hasattr(psutil, "sensors_fans"):
    print(psutil.sensors_fans())
Do not be surprised if temperature or fan dictionaries are empty. On many laptops and cloud machines, the OS simply does not expose that data to user-space Python.
Getting NVIDIA GPU Information
psutil does not provide GPU usage. Older versions of this tutorial used GPUtil, which still works for some NVIDIA setups, but it is a thin wrapper around nvidia-smi. In the updated script, we call nvidia-smi directly and parse CSV output. This keeps the dependency list smaller and makes it clear where the data comes from.
import csv
import shutil
import subprocess


def collect_nvidia_gpus():
    if not shutil.which("nvidia-smi"):
        return []

    fields = [
        "index",
        "name",
        "driver_version",
        "memory.total",
        "memory.used",
        "memory.free",
        "utilization.gpu",
        "temperature.gpu",
    ]
    command = [
        "nvidia-smi",
        f"--query-gpu={','.join(fields)}",
        "--format=csv,noheader,nounits",
    ]
    result = subprocess.run(command, capture_output=True, text=True, check=True, timeout=5)

    gpus = []
    for row in csv.reader(result.stdout.strip().splitlines()):
        gpus.append({field: value.strip() for field, value in zip(fields, row)})
    return gpus
This works for NVIDIA GPUs when the NVIDIA driver is installed. For AMD GPUs, look at ROCm tools such as rocm-smi. For Intel integrated graphics, the available telemetry depends on the OS and driver stack.
Building a Text and JSON Report
The complete script at the end of this tutorial supports both terminal output and JSON output. Example usage:
# Human-readable terminal report
python system_info_report.py

# JSON output
python system_info_report.py --json

# Save JSON to a file
python system_info_report.py --json --output report.json

# Include top 5 processes by CPU usage
python system_info_report.py --processes 5

# Include pseudo/special filesystems too
python system_info_report.py --all-partitions
JSON output is especially useful when you want to attach system information to bug reports or send it to a dashboard.
Privacy Note
System reports can include hostnames, usernames, local IP addresses, MAC addresses, process names, disk paths, and GPU UUIDs. If you are sharing a report publicly, review it first and remove anything sensitive.
Complete Code
The full script is available in the code section below as system_info_report.py. It is longer than the simple examples above, but it is safer for real use: it handles missing APIs, permission errors, containers, optional CPU info, no GPU, JSON export, and top-process sampling.
Conclusion
With psutil, platform, optional py-cpuinfo, and nvidia-smi, you can build a useful system information tool in pure Python. The result is portable enough for Windows, Linux, and macOS, while still giving you enough detail for monitoring, diagnostics, and support reports.
If you want to go further, you can schedule this script with cron or Task Scheduler, push the JSON to a database, or combine it with a small Flask/FastAPI dashboard.
Learn also: How to Make a Network Usage Monitor in Python.
Happy Coding ♥
Just finished the article? Now, boost your next project with our Python Code Generator. Discover a faster, smarter way to code.
View Full Code Build My Python Code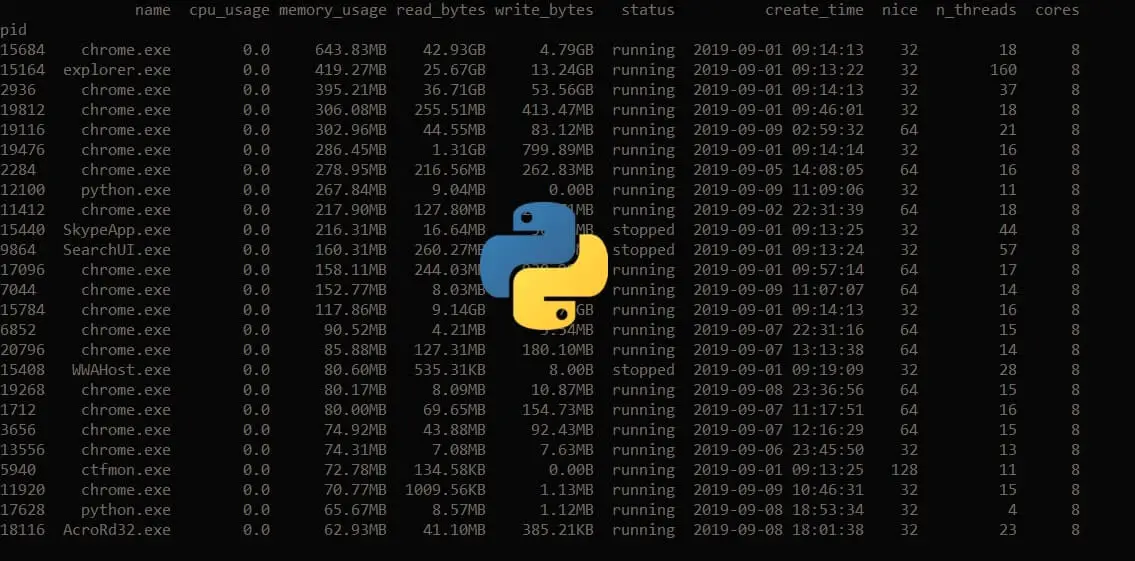


Got a coding query or need some guidance before you comment? Check out this Python Code Assistant for expert advice and handy tips. It's like having a coding tutor right in your fingertips!