Step up your coding game with AI-powered Code Explainer. Get insights like never before!
Have you ever wanted to make a program that monitors the network usage of your machine? In this tutorial, we will make three Python scripts that monitor total network usage, network usage per network interface, and network usage per system process:
To get started, let's install the required libraries:
$ pip install psutil scapy pandaspsutil is a cross-platform library for retrieving information on running processes and system and hardware information in Python, we will be using it for retrieving network statistics as well as established connections.
1. Total Network Usage
Starting with the simplest program; Let's import psutil and make a function that prints the bytes in a nice format:
import psutil
import time

UPDATE_DELAY = 1 # in seconds

def get_size(bytes):
    """
    Returns size of bytes in a nice format
    """
    for unit in ['', 'K', 'M', 'G', 'T', 'P']:
        if bytes < 1024:
            return f"{bytes:.2f}{unit}B"
        bytes /= 1024
Next, we will use psutil.net_io_counters() function that returns the network input and output statistics:
# get the network I/O stats from psutil
io = psutil.net_io_counters()
# extract the total bytes sent and received
bytes_sent, bytes_recv = io.bytes_sent, io.bytes_recv
Now let's enter the loop that gets the same stats but after a delay so we can calculate the download and upload speed:
while True:
    # sleep for `UPDATE_DELAY` seconds
    time.sleep(UPDATE_DELAY)
    # get the stats again
    io_2 = psutil.net_io_counters()
    # new - old stats gets us the speed
    us, ds = io_2.bytes_sent - bytes_sent, io_2.bytes_recv - bytes_recv
    # print the total download/upload along with current speeds
    print(f"Upload: {get_size(io_2.bytes_sent)}   "
          f", Download: {get_size(io_2.bytes_recv)}   "
          f", Upload Speed: {get_size(us / UPDATE_DELAY)}/s   "
          f", Download Speed: {get_size(ds / UPDATE_DELAY)}/s      ", end="\r")
    # update the bytes_sent and bytes_recv for next iteration
    bytes_sent, bytes_recv = io_2.bytes_sent, io_2.bytes_recv
We simply subtract the old network stats from the new stats to get the speed, we will also include the total downloaded and uploaded stats. Since we want the printing to be updated in one line and not printed in several lines, we pass the return character "\r" to the end parameter in the print() function to return to the beginning of the same line after printing. Let's run it:
$ python network_usage.pyThe output will be updated every second:
Upload: 19.96MB , Download: 114.03MB , Upload Speed: 4.25KB/s , Download Speed: 207.00B/s And that's it! We have successfully made a quick script to get the total upload and download usage along with the speed. In the next section, we will do the same thing but show usage per interface, it's useful if you're connected to several networks using several network adapters.
2. Network Usage per Network Interface
In this section, we use the same method as before, but we set pernic to True:
import psutil
import time
import os
import pandas as pd

UPDATE_DELAY = 1 # in seconds

def get_size(bytes):
    """
    Returns size of bytes in a nice format
    """
    for unit in ['', 'K', 'M', 'G', 'T', 'P']:
        if bytes < 1024:
            return f"{bytes:.2f}{unit}B"
        bytes /= 1024

# get the network I/O stats from psutil on each network interface
# by setting `pernic` to `True`
io = psutil.net_io_counters(pernic=True)
Let's now enter the while loop:
while True:
    # sleep for `UPDATE_DELAY` seconds
    time.sleep(UPDATE_DELAY)
    # get the network I/O stats again per interface
    io_2 = psutil.net_io_counters(pernic=True)
    # initialize the data to gather (a list of dicts)
    data = []
    for iface, iface_io in io.items():
        # new - old stats gets us the speed
        upload_speed, download_speed = io_2[iface].bytes_sent - iface_io.bytes_sent, io_2[iface].bytes_recv - iface_io.bytes_recv
        data.append({
            "iface": iface, "Download": get_size(io_2[iface].bytes_recv),
            "Upload": get_size(io_2[iface].bytes_sent),
            "Upload Speed": f"{get_size(upload_speed / UPDATE_DELAY)}/s",
            "Download Speed": f"{get_size(download_speed / UPDATE_DELAY)}/s",
        })
    # update the I/O stats for the next iteration
    io = io_2
    # construct a Pandas DataFrame to print stats in a cool tabular style
    df = pd.DataFrame(data)
    # sort values per column, feel free to change the column
    df.sort_values("Download", inplace=True, ascending=False)
    # clear the screen based on your OS
    os.system("cls") if "nt" in os.name else os.system("clear")
    # print the stats
    print(df.to_string())
This time, the psutil.net_io_counters() returns a dictionary of each interface and its corresponding network stats. Inside the while loop, we iterate over this dictionary and do the same calculation as before.
Since we have multiple lines, we're using pandas to print the stats in a tabular manner and use the cls command on Windows or clear on Linux or macOS to clear the screen before printing the updated results.
To print the whole pandas dataframe, we simply call the to_string() method inside the print() function and it will do the job. Let's run it:
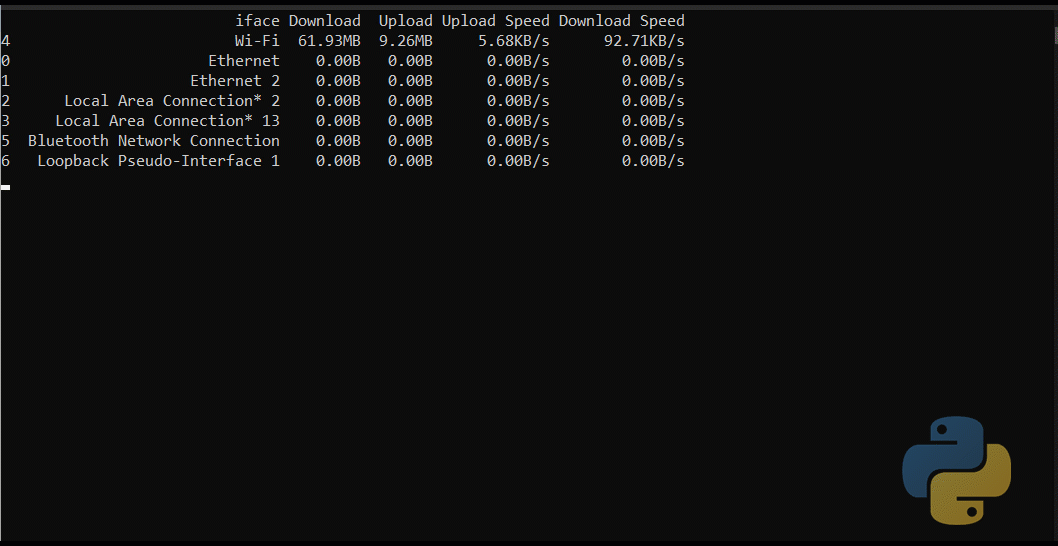
$ pip install network_usage_per_interface.pyHere's the output:
3. Network Usage per Process
Unfortunately, psutil has the ability only to track the total network usage or network usage per network interface. To be able to monitor usage per process, we have to use yet another library and that is Scapy.
Scapy is a powerful packet manipulation tool that provides us the ability to sniff outgoing and incoming packets in our machine. Check our tutorials if you want to learn more about using it.
This time, we will use the psutil library to get the current network connections and extract the source and destination ports and the process ID (PID) that is responsible for the connection.
We then match this information while sniffing for packets using Scapy and put the traffic stats in the corresponding PID. Let's get started:
from scapy.all import *
import psutil
from collections import defaultdict
import os
from threading import Thread
import pandas as pd

# get the all network adapter's MAC addresses
all_macs = {iface.mac for iface in ifaces.values()}
# A dictionary to map each connection to its correponding process ID (PID)
connection2pid = {}
# A dictionary to map each process ID (PID) to total Upload (0) and Download (1) traffic
pid2traffic = defaultdict(lambda: [0, 0])
# the global Pandas DataFrame that's used to track previous traffic stats
global_df = None
# global boolean for status of the program
is_program_running = True

def get_size(bytes):
    """
    Returns size of bytes in a nice format
    """
    for unit in ['', 'K', 'M', 'G', 'T', 'P']:
        if bytes < 1024:
            return f"{bytes:.2f}{unit}B"
        bytes /= 1024
After we import the necessary libraries, we initialize our global variables that will be used in our upcoming functions:
all_macsis a Python set that contains the MAC addresses of all network interfaces in our machine.connection2pidis a Python dictionary that maps each connection (represented as the source and destination ports on the TCP/UDP layer).pid2trafficis another dictionary that maps each process ID (PID) to a list of two values representing the upload and download traffic.global_dfis a Pandas dataframe that is used to store the previous traffic data (so we can calculate the usage).is_program_runningis simply a boolean that is when set toFalse, the program will stop and exit.
If you're not familiar with Scapy, then to be able to sniff packets, we have to use the sniff() function provided by this library. This function accepts several parameters, one of the important ones is the callback that is called whenever a packet is captured. Before we call sniff(), let's make our callback:
def process_packet(packet):
    global pid2traffic
    try:
        # get the packet source & destination IP addresses and ports
        packet_connection = (packet.sport, packet.dport)
    except (AttributeError, IndexError):
        # sometimes the packet does not have TCP/UDP layers, we just ignore these packets
        pass
    else:
        # get the PID responsible for this connection from our `connection2pid` global dictionary
        packet_pid = connection2pid.get(packet_connection)
        if packet_pid:
            if packet.src in all_macs:
                # the source MAC address of the packet is our MAC address
                # so it's an outgoing packet, meaning it's upload
                pid2traffic[packet_pid][0] += len(packet)
            else:
                # incoming packet, download
                pid2traffic[packet_pid][1] += len(packet)
Related: How to Make a SYN Flooding Attack in Python.
The process_packet() callback accepts a packet as an argument. If there are TCP or UDP layers in the packet, it extracts the source and destination ports and tries to use the connection2pid dictionary to get the PID responsible for this connection. If it does find it, and if the source MAC address is one of the machine's MAC addresses, then it adds the packet size to the upload traffic. Otherwise, it adds it to the download traffic.
Next, let's make the function responsible for getting the connections:
def get_connections():
    """A function that keeps listening for connections on this machine
    and adds them to `connection2pid` global variable"""
    global connection2pid
    while is_program_running:
        # using psutil, we can grab each connection's source and destination ports
        # and their process ID
        for c in psutil.net_connections():
            if c.laddr and c.raddr and c.pid:
                # if local address, remote address and PID are in the connection
                # add them to our global dictionary
                connection2pid[(c.laddr.port, c.raddr.port)] = c.pid
                connection2pid[(c.raddr.port, c.laddr.port)] = c.pid
        # sleep for a second, feel free to adjust this
        time.sleep(1)
The above function is the one accountable for filling the connection2pid global variable that is used in the process_packet() function. Of course, the connections can be made at any second, that's why we keep listening for connections every second or so in a loop.
Next, writing the function that calculates the network usage and prints our collected data:
def print_pid2traffic():
    global global_df
    # initialize the list of processes
    processes = []
    for pid, traffic in pid2traffic.items():
        # `pid` is an integer that represents the process ID
        # `traffic` is a list of two values: total Upload and Download size in bytes
        try:
            # get the process object from psutil
            p = psutil.Process(pid)
        except psutil.NoSuchProcess:
            # if process is not found, simply continue to the next PID for now
            continue
        # get the name of the process, such as chrome.exe, etc.
        name = p.name()
        # get the time the process was spawned
        try:
            create_time = datetime.fromtimestamp(p.create_time())
        except OSError:
            # system processes, using boot time instead
            create_time = datetime.fromtimestamp(psutil.boot_time())
        # construct our dictionary that stores process info
        process = {
            "pid": pid, "name": name, "create_time": create_time, "Upload": traffic[0],
            "Download": traffic[1],
        }
        try:
            # calculate the upload and download speeds by simply subtracting the old stats from the new stats
            process["Upload Speed"] = traffic[0] - global_df.at[pid, "Upload"]
            process["Download Speed"] = traffic[1] - global_df.at[pid, "Download"]
        except (KeyError, AttributeError):
            # If it's the first time running this function, then the speed is the current traffic
            # You can think of it as if old traffic is 0
            process["Upload Speed"] = traffic[0]
            process["Download Speed"] = traffic[1]
        # append the process to our processes list
        processes.append(process)
    # construct our Pandas DataFrame
    df = pd.DataFrame(processes)
    try:
        # set the PID as the index of the dataframe
        df = df.set_index("pid")
        # sort by column, feel free to edit this column
        df.sort_values("Download", inplace=True, ascending=False)
    except KeyError as e:
        # when dataframe is empty
        pass
    # make another copy of the dataframe just for fancy printing
    printing_df = df.copy()
    try:
        # apply the function get_size to scale the stats like '532.6KB/s', etc.
        printing_df["Download"] = printing_df["Download"].apply(get_size)
        printing_df["Upload"] = printing_df["Upload"].apply(get_size)
        printing_df["Download Speed"] = printing_df["Download Speed"].apply(get_size).apply(lambda s: f"{s}/s")
        printing_df["Upload Speed"] = printing_df["Upload Speed"].apply(get_size).apply(lambda s: f"{s}/s")
    except KeyError as e:
        # when dataframe is empty again
        pass
    # clear the screen based on your OS
    os.system("cls") if "nt" in os.name else os.system("clear")
    # print our dataframe
    print(printing_df.to_string())
    # update the global df to our dataframe
    global_df = df
The above function iterates over the pid2traffic dictionary, and tries to get the process object using psutil so it can get the name and creation time of the process using the name() and create_time() methods, respectively.
After we create our process dictionary that has most of the information we need about the process including the total usage, we use global_df to get the previous total usage and then calculate the current upload and download speed using that. After that, we append this process to our processes list and convert it as a pandas dataframe to print it.
Before we print the dataframe, we can do some modifications such as sorting by "Download" usage, and also apply the get_size() utility function to print the bytes in a nice scalable format.
Let's make yet another function that calls the above function every second:
def print_stats():
    """Simple function that keeps printing the stats"""
    while is_program_running:
        time.sleep(1)
        print_pid2traffic()
So now, we have two functions that keeps running in separate threads, one is the above print_stats() and the second is the get_connections(). Let's make the main code:
if __name__ == "__main__":
    # start the printing thread
    printing_thread = Thread(target=print_stats)
    printing_thread.start()
    # start the get_connections() function to update the current connections of this machine
    connections_thread = Thread(target=get_connections)
    connections_thread.start()
Finally, let's start sniffing using the Scapy's sniff() function:
    # start sniffing
    print("Started sniffing")
    sniff(prn=process_packet, store=False)
    # setting the global variable to False to exit the program
    is_program_running = False
We pass our previously defined process_packet() function to the prn argument, and set store to False so we won't store the captured packets in the memory.
We simply set is_program_running to False whenever we exit out of the sniff() function for whatever reason (including pressing CTRL+C). Let's run our program now:
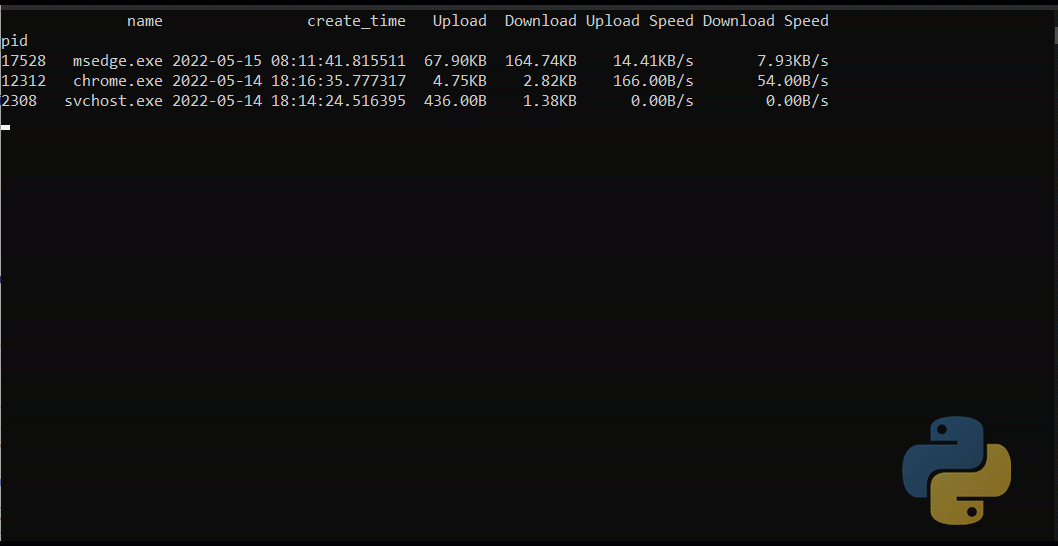
$ python network_usage_per_process.pyHere's the output:
In the process monitor tutorial, we have included a lot of columns (but not the network usage) in our monitor, feel free to add them here if you want to.
Note: This code may contain issues and bugs, you're free to comment, or suggest any change if you spot any issue.
Conclusion
Excellent, now you have three programs for monitoring network usage, feel free to edit and use the code as you wish, such as updating UPDATE_DELAY or changing the sorting column, or anything else.
Also, there is a lot you can do with psutil, you can make a process monitor, or extract various system and hardware information on your machine, check the tutorials if you're curious how to do that.
Get the complete code for the three programs here.
Learn also: Keyboard module: Controlling your Keyboard in Python
Happy coding ♥
Take the stress out of learning Python. Meet our Python Code Assistant – your new coding buddy. Give it a whirl!
View Full Code Generate Python Code


Got a coding query or need some guidance before you comment? Check out this Python Code Assistant for expert advice and handy tips. It's like having a coding tutor right in your fingertips!