Before we get started, have you tried our new Python Code Assistant? It's like having an expert coder at your fingertips. Check it out!
There are many cases where you have to convert your Pandas dataframe into an HTML table. Two of the primary reasons are that you want to better view your dataset as a data analyst or integrate it into your organization's website.
In this tutorial, we will convert any Pandas dataframe into an interactive table with pagination, and we can sort by column and search.
To get started, of course, you have to have Pandas installed:
$ pip install pandasImporting the necessary libraries:
import pandas as pd
import webbrowser
We'll be using webbrowser module to automatically open the resulting HTML table in a new tab on the default browser.
Let's make a function that accepts the dataframe as an argument and returns the HTML content for that:
def generate_html(dataframe: pd.DataFrame):
    # get the table HTML from the dataframe
    table_html = dataframe.to_html(table_id="table")
    # construct the complete HTML with jQuery Data tables
    # You can disable paging or enable y scrolling on lines 20 and 21 respectively
    html = f"""
    <html>
    <header>
        <link href="https://cdn.datatables.net/1.11.5/css/jquery.dataTables.min.css" rel="stylesheet">
    </header>
    <body>
    {table_html}
    <script src="https://code.jquery.com/jquery-3.6.0.slim.min.js" integrity="sha256-u7e5khyithlIdTpu22PHhENmPcRdFiHRjhAuHcs05RI=" crossorigin="anonymous"></script>
    <script type="text/javascript" src="https://cdn.datatables.net/1.11.5/js/jquery.dataTables.min.js"></script>
    <script>
        $(document).ready( function () {{
            $('#table').DataTable({{
                // paging: false,
                // scrollY: 400,
            }});
        }});
    </script>
    </body>
    </html>
    """
    # return the html
    return html
Luckily, Pandas has a built-in to_html() method that generates the HTML content of that dataframe as a table tag. After that, we make a complete HTML page and add a jQuery data tables extension, so it's interactive.
By default, pagination, sorting by column, and searching are enabled; you can disable them if you want. For example, if you wish to disable pagination and show the entire dataframe, you can uncomment paging: false (remember the commenting in Javascript is "//" and not "#" as in Python).
I'm grabbing this dataset for demonstration purposes. Let's try it out:
if __name__ == "__main__":
# read the dataframe dataset
df = pd.read_csv("Churn_Modelling.csv")
# take only first 1000, otherwise it'll generate a large html file
df = df.iloc[:1000]
# generate the HTML from the dataframe
html = generate_html(df)
# write the HTML content to an HTML file
open("index.html", "w").write(html)
# open the new HTML file with the default browser
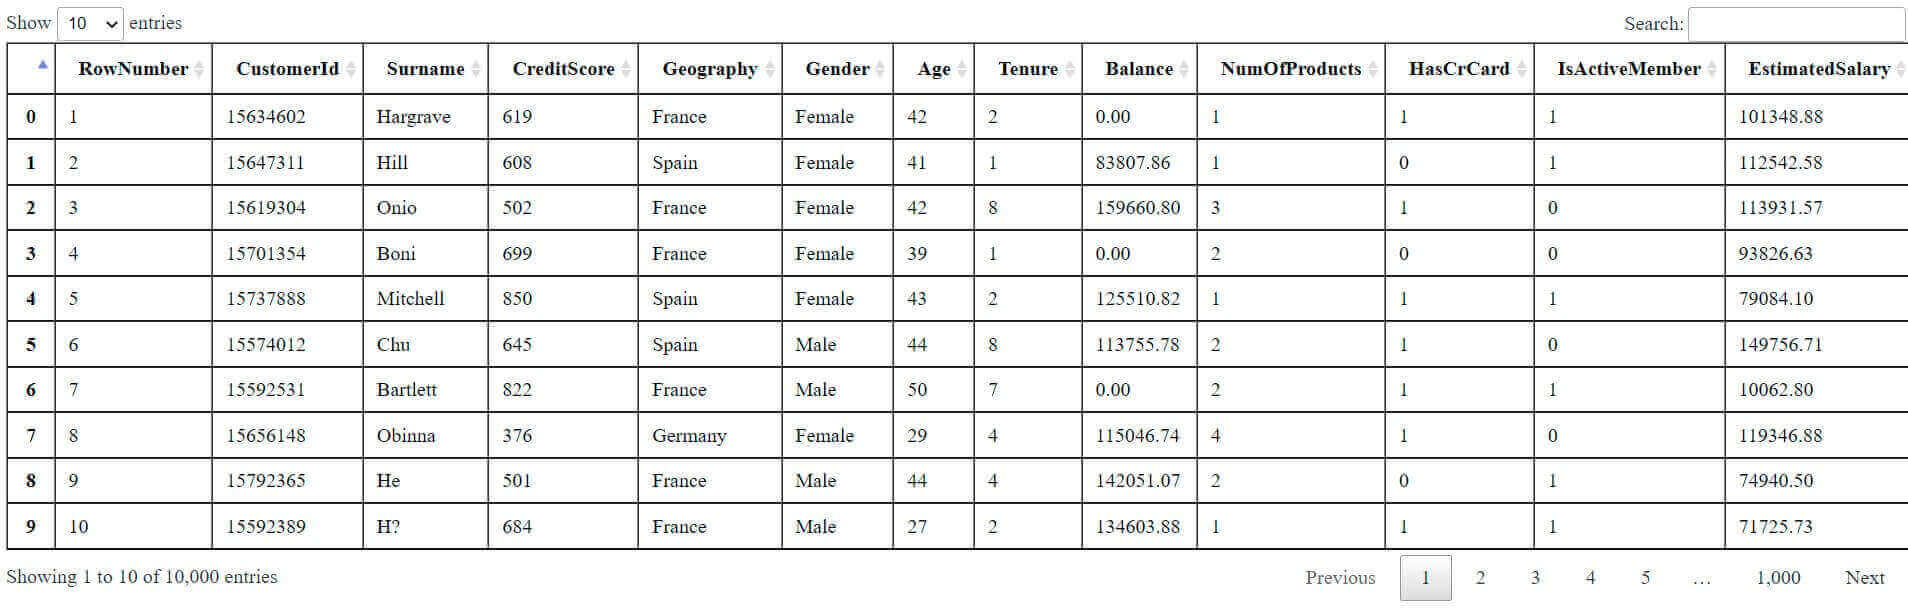
webbrowser.open("index.html")After we get our HTML content, we write it into a new index.html file and open it with webbrowser.open() function. Here's what it looks like:
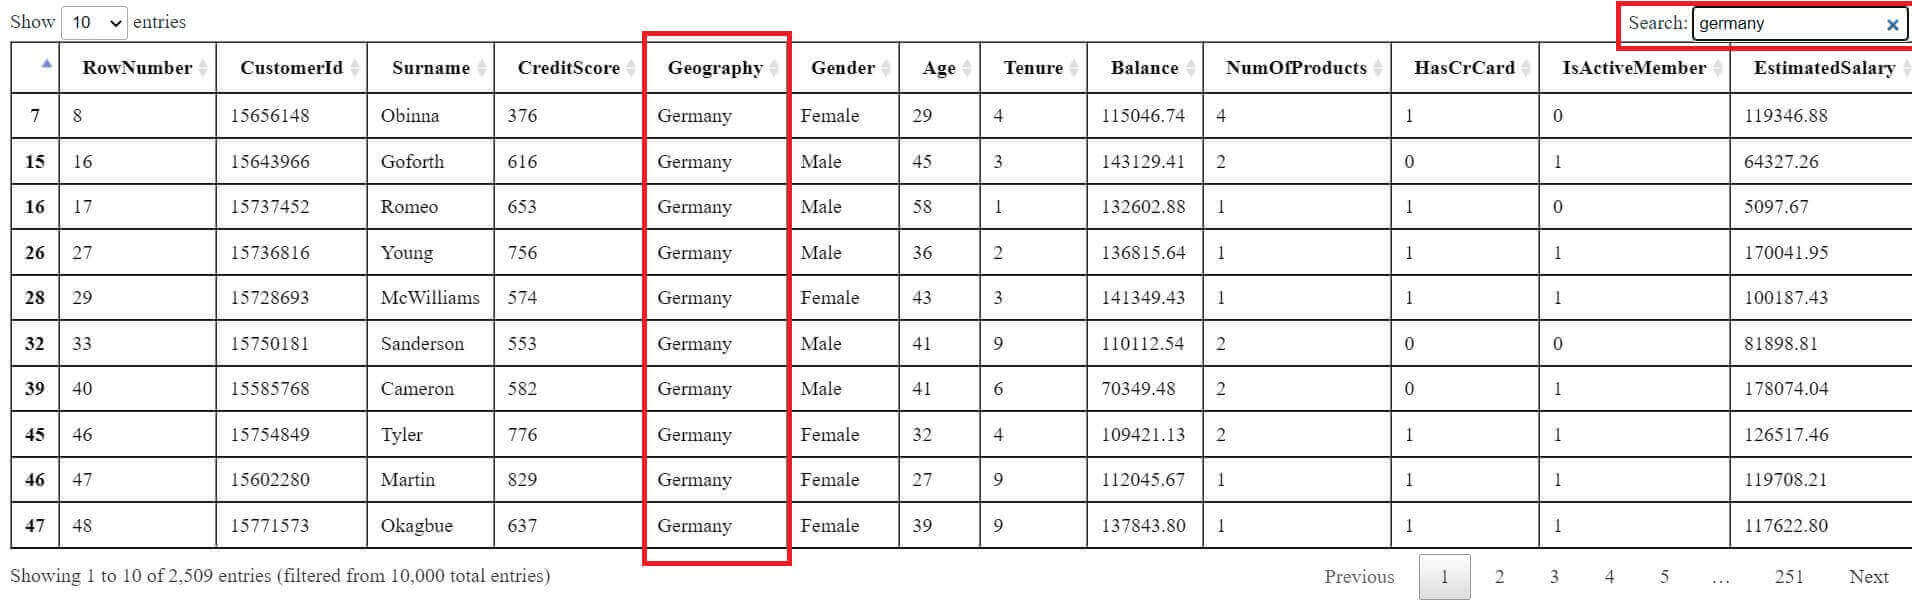
 The cool thing is that we can search on the table:
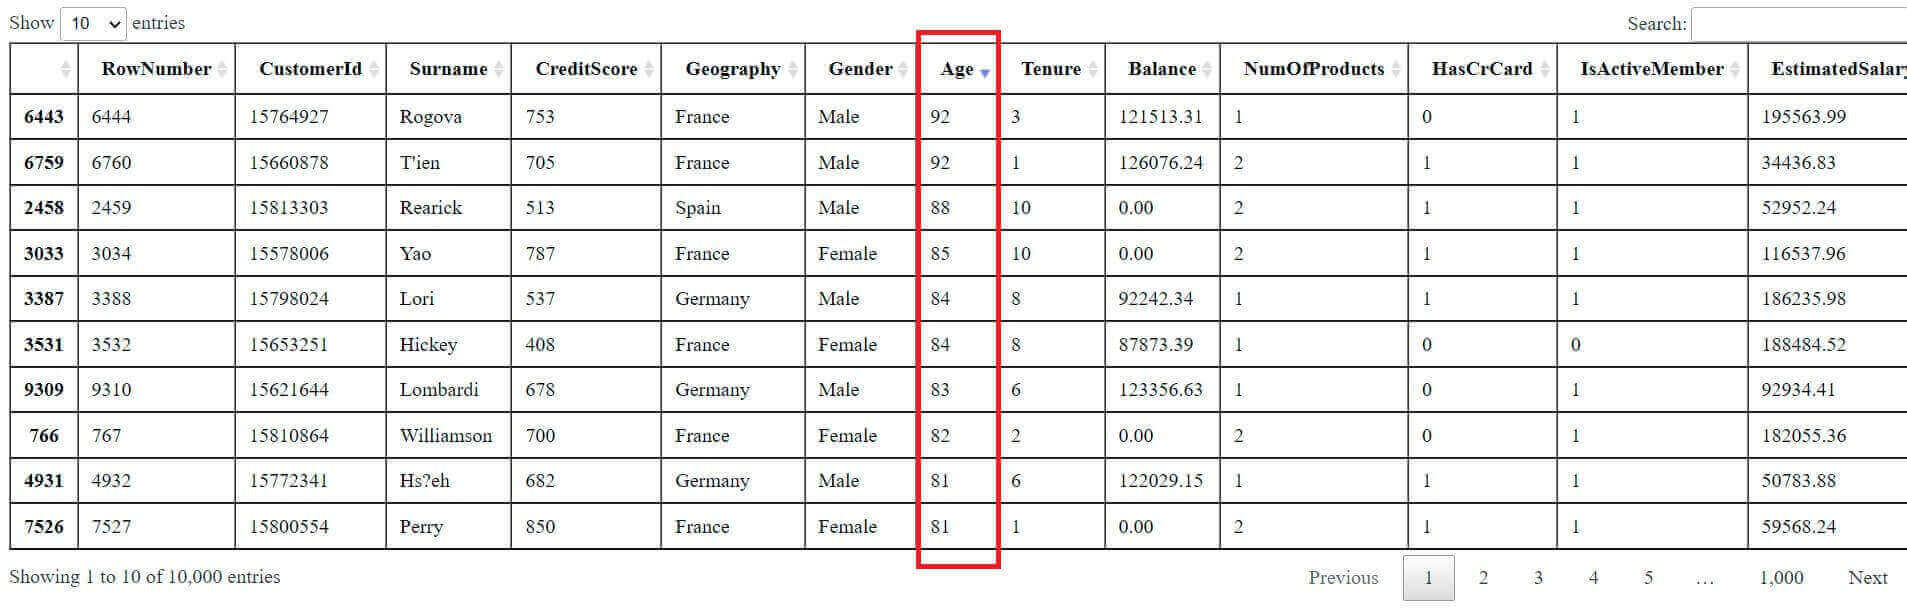
 Or sort by a specific column:
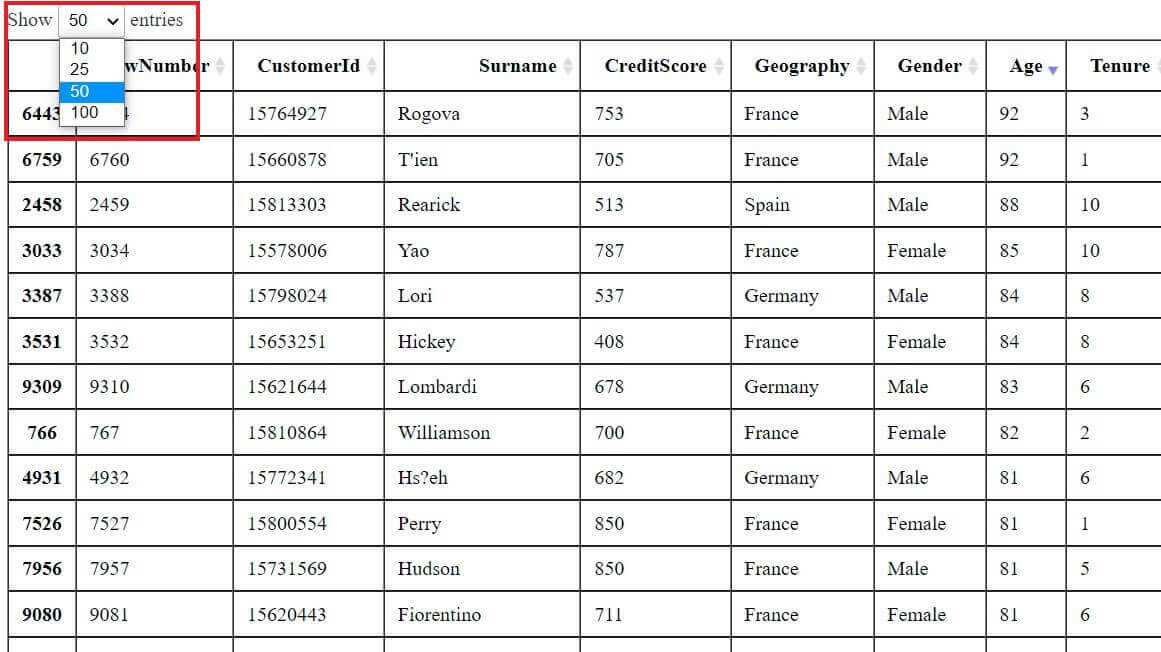
 Or edit the pagination settings, for example showing 50 entries per page:
 You can also see the pages below the table:
 Conclusion
Alright! That's it for the tutorial. I hope it's helpful for you to view your dataset better or integrate it as HTML content on your website.
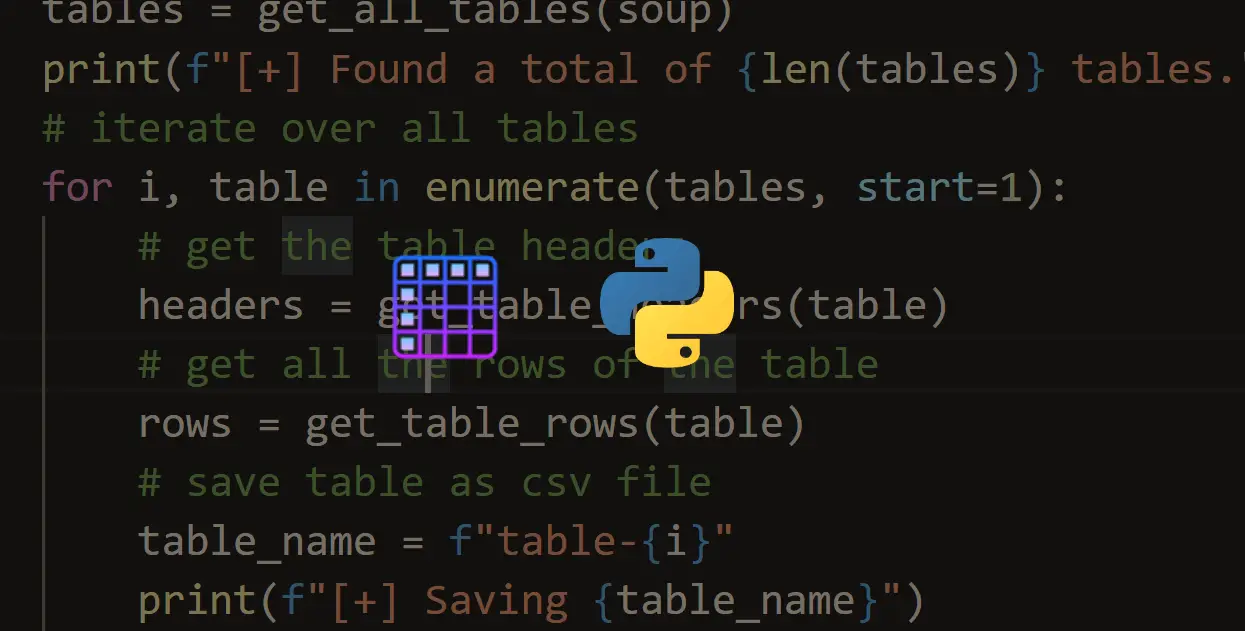
If you want the other way around, extracting HTML tables and converting them to CSV files, then check this tutorial.
The dataset used in this tutorial is originally from Kaggle. You can get it here if you don't have a Kaggle account.
Note that the styling of the table will only work if you have Internet connectivity. If you want it to work offline, you can simply download the JS/CSS files and put them in the current directory so it loads them from your local machine instead of from a CDN.
You can get the complete code here.
Learn also: How to Extract Tables from PDF in Python
Happy coding ♥
Finished reading? Keep the learning going with our AI-powered Code Explainer. Try it now!
View Full Code Auto-Generate My Code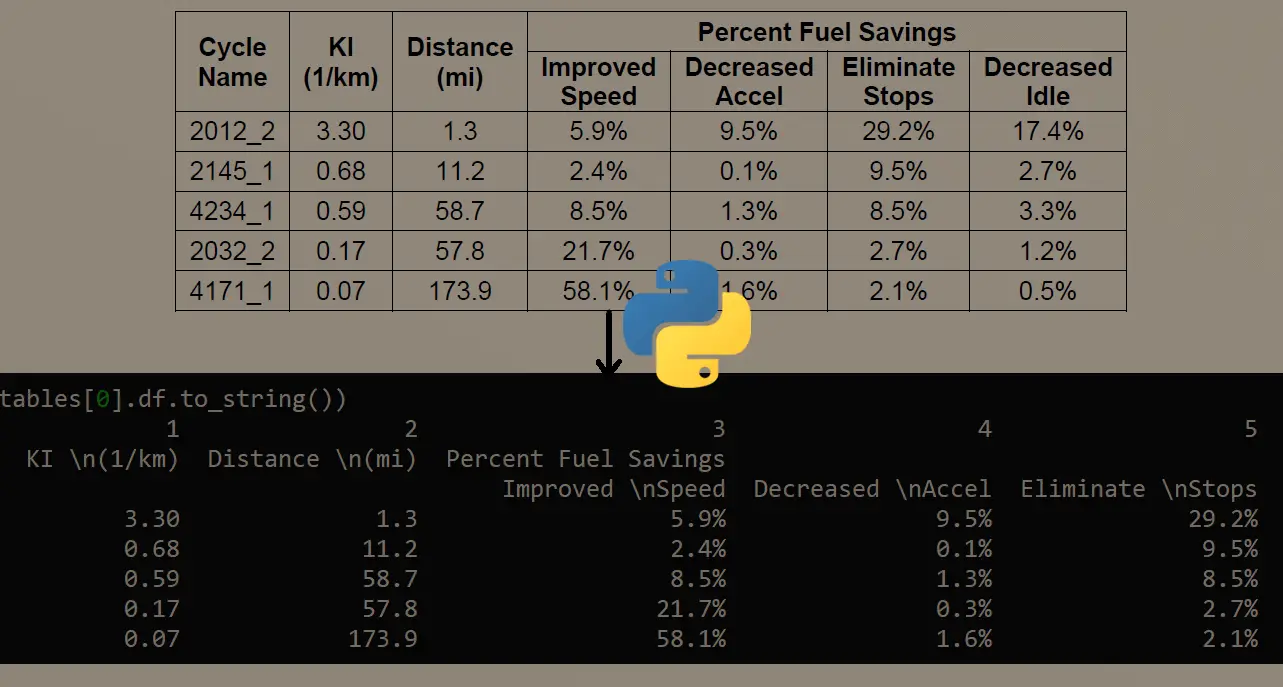


Got a coding query or need some guidance before you comment? Check out this Python Code Assistant for expert advice and handy tips. It's like having a coding tutor right in your fingertips!